Observing The Weather - Weather Information Portal
- Share this page


Observations of the weather are done from the ground, sea, sky and even outer space
MSS has a network of meteorological observing stations, both manned and automated; these provide real-time observations across Singapore. There are five manned observation stations located at Changi, Seletar, Sembawang, Tengah, and Paya Lebar, as well as an Upper Air Observatory located at Upper Paya Lebar. There are over 60 automatic weather stations island-wide, with about 20 of these stationsequipped with the full complement of rainfall, temperature, humidity,surface wind and air pressure sensors.
Rainfall is recorded with a rain gauge, which determines the depth of precipitation that occurs over a unit area. One millimeter of measured rainfall is equivalent to one litre of rainfall per square metre.
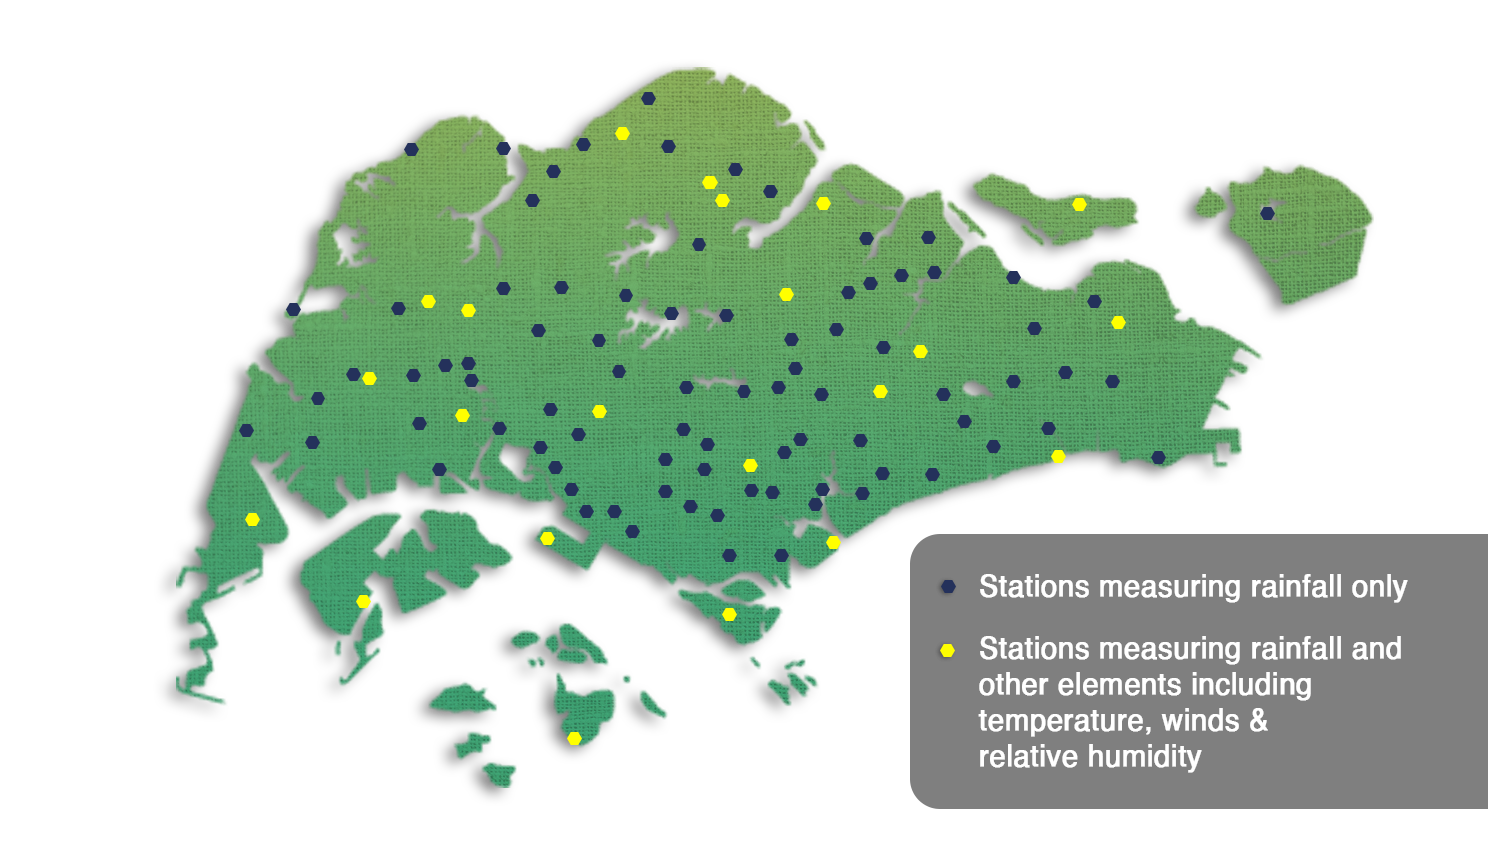
MSS uses the tipping bucket rain gauge, which uses a seesaw mechanism to measure both the amount and intensity of rainfall — when rain fills one end of the ‘bucket’ to the brim, it tips over and is recorded as a quantum unit of rainfall (e.g. 0.2 mm). The more the ‘bucket’ tips from side to side, the higher the amount of measured rainfall. The faster the ‘bucket’ tips from side to side, the higher the intensity of measured rainfall.
There are over 100 electronic tipping bucket rain gauges across the island.
 Network of more than 100 automated rain gauges across the island
 Tipping bucket rain sensor
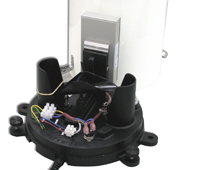
Meteorological Services around the world measure the true air temperature. This is the temperature measured with a thermometer or temperature sensor enclosed in a white louvered radiation shield that allows air to circulate within and shelters the thermometer or temperature sensor from rain and the direct exposure to solar radiation. An example of such a shield is the conventional Stevenson Screen. The shield is usually painted white to better reflect the sun’s rays (as opposed to dark colours which absorb heat). The World Meteorological Organization provides guidelines on the siting of Stevenson screens or radiation shields at heights of between 1.25m and 2m above ground. This is to avoid heat from the ground affecting the temperature measurement.
 Thermometers are housed in a Stevenson screen to measure the true air temperature. The screen shelters the thermometers from direct solar radiation while allowing air to circulate through the louvres. The screen is placed at a height* above-ground to avoid heat from the ground affecting the readings. (*in accordance with World Meteorological Organisation guidelines for siting of meteorological instruments)
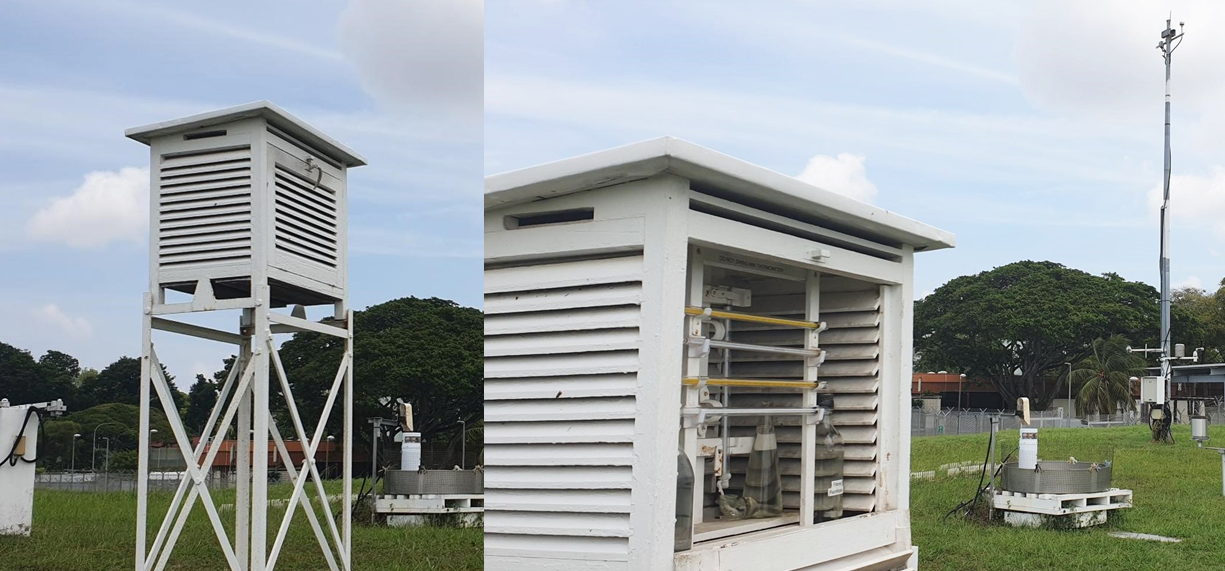
 The temperature sensor at an Automatic Weather Station is also housed within a louvered radiation shield.
There are many temperature readings around us which may differ from the true air temperature measured by the meteorological authorities. Thermometers that are exposed to direct sunlight absorb considerable radiation from the sun, the ground and other surrounding objects. Such thermometers are likely to register a temperature reading that is higher than the true air temperature. A common example is the outside temperature sensor reading in vehicles which usually reads several degrees higher than the air temperature. While the outside temperature sensor itself is accurate, it is usually located under the hood near the lower half of the car. As such, the temperature sensor picks up the heat from the road surface and the heat absorbed by the metal body of the car, and this difference could be significant if the car has been exposed to direct sunlight for some time.
There are various ways of measuring moisture in the atmosphere. The relative humidity (RH, expressed as a percentage) is a measure of the amount of water vapour in the air compared to the maximum that could be contained by the air at the same temperature. If the amount of water vapour in the air remains constant, the RH decreases (increases) as the temperature rises (falls). In Singapore, a normal diurnal range is 95-100% around dawn to about 60-70% in the afternoon.
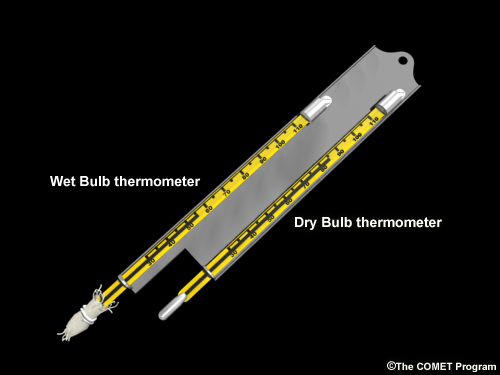 Psychrometer (Image credit: COMET)
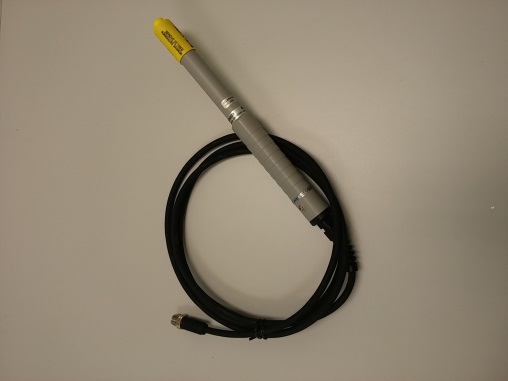 Relative humidity and temperature probe/sensor
The best known instrument for humidity measurement is the psychrometer, which consists of two different thermometers to measure the dry bulb and wet bulb temperatures. The dry bulb temperature is the actual air temperature. The wet bulb temperature is the lowest temperature to which air can be cooled by evaporating water into it. The wet bulb temperature is always lower than the dry bulb temperature if the air is not saturated with water vapour. Today, humidity is measured with electronic humidity sensors.
Measurements of surface wind strength are made at 10 metres above the ground. A specified height is used because the wind speed decreases towards the ground. The direction given for the wind refers to the direction from which it blows e.g. an easterly wind is blowing from the east towards the west.
Conventional instruments used to measure wind speed and direction are the anemometer and the wind vane. Today, wind is measured with ultrasonic wind sensors. As winds fluctuate in speed and direction, the measurements are averaged over a specific period of time.
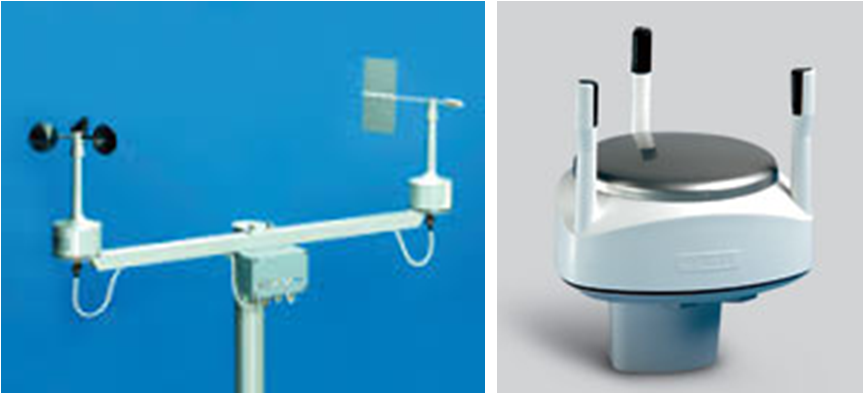 Conventional wind anemometer and vane
(left) and ultrasonic wind sensor (right)
A wind profiler radar or a wind profiler provides continuous real-time wind measurements at different heights in the atmosphere. The system functions like a weather radar, relying on pulses of electromagnetic radiation that emit upwards and reflect off moisture in the atmosphere. The movement of the moisture particles is measured via the reflected radiation, providing an indication of the speed and direction of the winds aloft. https://www.weather.gov.sg/wp-content/uploads/2020/11/AWS-island-wide_2020.png 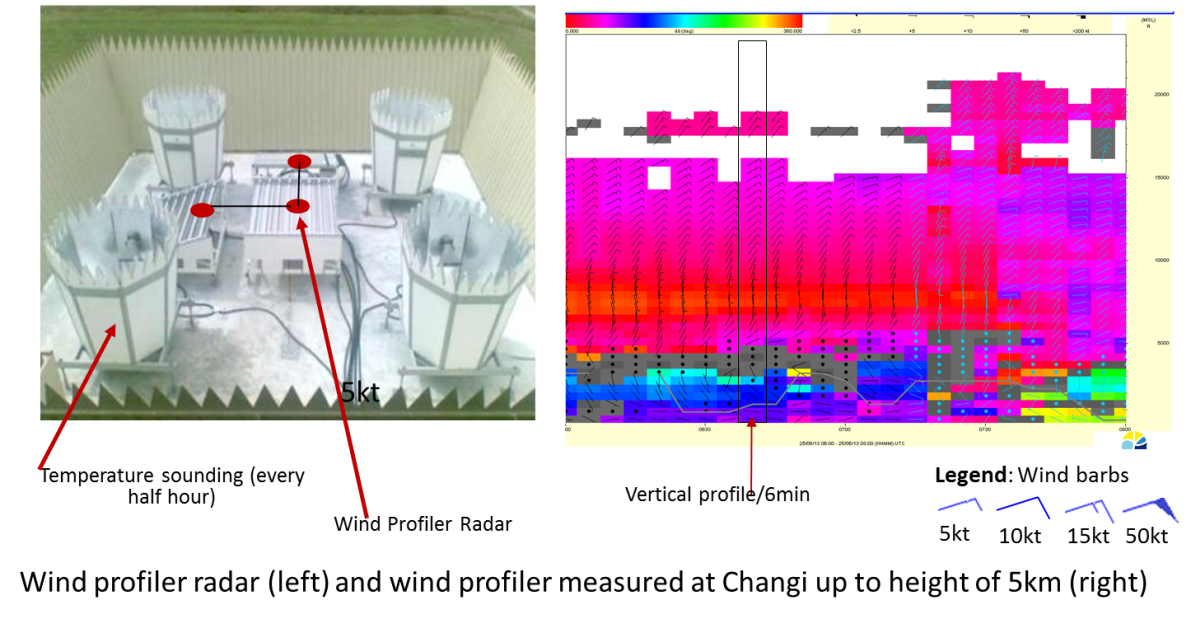
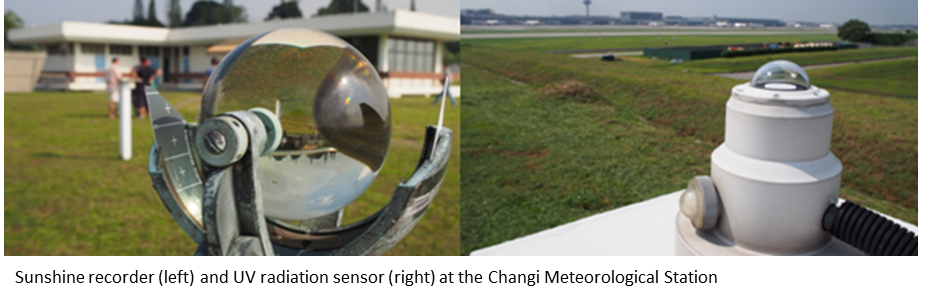
Daily hours of sunshine are measured with a sunshine recorder or pyrheliometer. The instrument comprises a glass globe with a recorder card placed at its base. As the sun shines through the glass globe, the sunlight burns a hole on the recorded card. The number of hours of sunshine each day is derived from the time taken between the first and last burnt marks on the card. Clouds and rain reduce the amount of sunlight.
Photodiode sensors measure the amount of solar radiation. These include the UV radiation sensor, total radiation sensors, and net radiation sensors.
A significant change in Singapore’s ground-based weather observations in the late 2000s came from a growing network of Automatic Weather Stations (AWS). These systems provide continuous measurements of key weather elements which are essential for weather forecasting. The measurements also contribute to monitoring of local climatic trends. The AWS is mounted with different sensors measuring temperature, humidity, rainfall, wind speed and direction, and air pressure, replacing the traditional manual instruments. However, the role of the human observer remains important in recognizing and describing current weather conditions and subtle features of clouds.
MSS’ island-wide network of AWS increased from 60+ stations in 2015 to 100+ stations in 2020. All the stations record rainfall, while about 20 of them also record temperature, humidity, wind and air pressure.
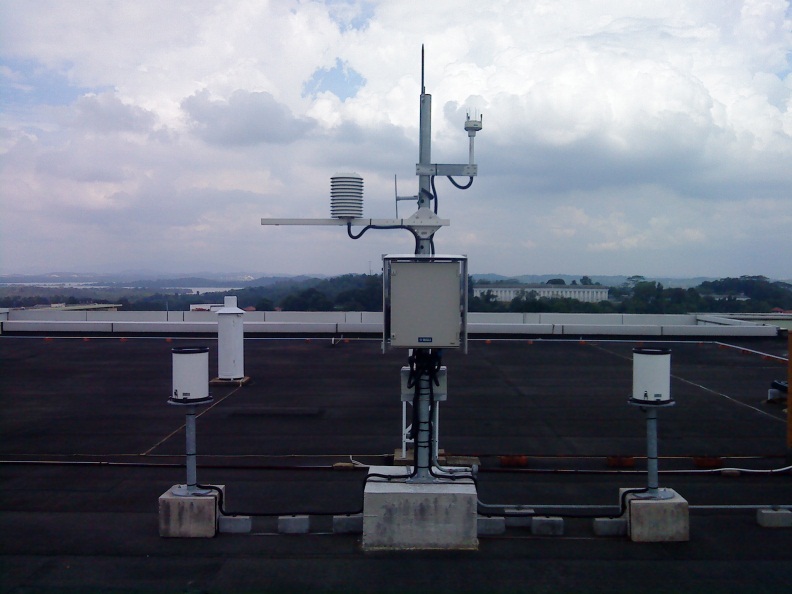 The Automatic Weather Station at Jurong Island is part of an island-wide network of 100+ stations
In addition to the surface observations, vertical profiles of winds and other key elements are measured twice daily by a weather balloon tracked by radar.
An electronic device called a “radiosonde” is attached to a helium-filled balloon, which is released at around the same time as other stations around the world (at 0000 UTC and 1200 UTC). As the balloon ascends into the atmosphere, the radiosonde measures the wind speed and direction, temperature, humidity and air pressure from the surface to a height of up to 35 km.
Meteorological measurements of the upper atmosphere provide the meteorologist with useful information to assess the stability state of the atmosphere and potential thunderstorm development. The information is also important for civil aviation and Numerical Weather Prediction (NWP) modeling.
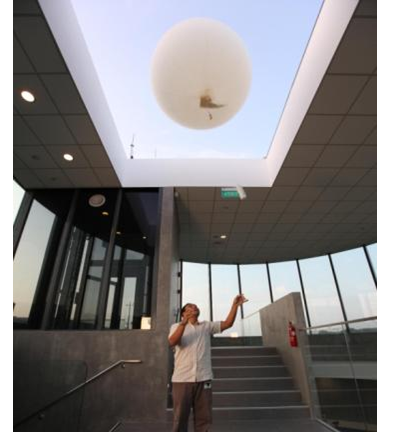 Releasing a weather balloon carrying a radiosonde.
Remote sensing involves observing objects indirectly, either actively or passively; the measurement devices are not in direct contact with the objects being sensed. Active remote sensors emit electromagnetic waves that travel to an object and are reflected back toward the sensor. Passive remote sensors observe electromagnetic waves emitted by objects.
Remotely sensed data from meteorological radars, wind profiler radars, satellites and lightning detection systems are an important source of information for the meteorologist in the monitoring and analysis of the current weather situation. These data complement the surface and upper-air observational data to form a more complete and continuous picture of atmospheric conditions.
Radar stands for ‘Radio Detection and Ranging’. A meteorological radar transmits electromagnetic pulses that reflect off tracers such as water droplets in clouds, and detects the reflected signals or echoes. It detects precipitation (rain, hail, snow) up to a few hundred kilometres away, and estimates their intensity from the strength of the echoes. It also provides a cross section view through storms. Advanced radar systems can measure any frequency shift in the returning signal (the Doppler effect) and from this it is possible to estimate the winds in storms.
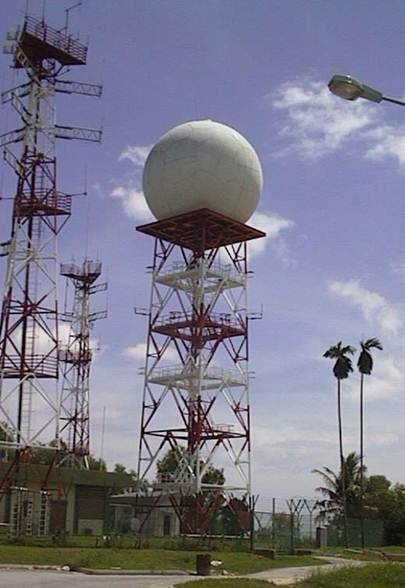 Meteorological Doppler Radar
Meteorologists use the weather radar to monitor the development and movement of weather systems and to analyse the structure of a storm. With its additional capability to detect wind shear (sudden changes in wind velocity) and microbursts (strong downbursts of wind), which are hazardous to aircraft operations, the radar is also a critical tool in the provision of severe weather warnings for airports.
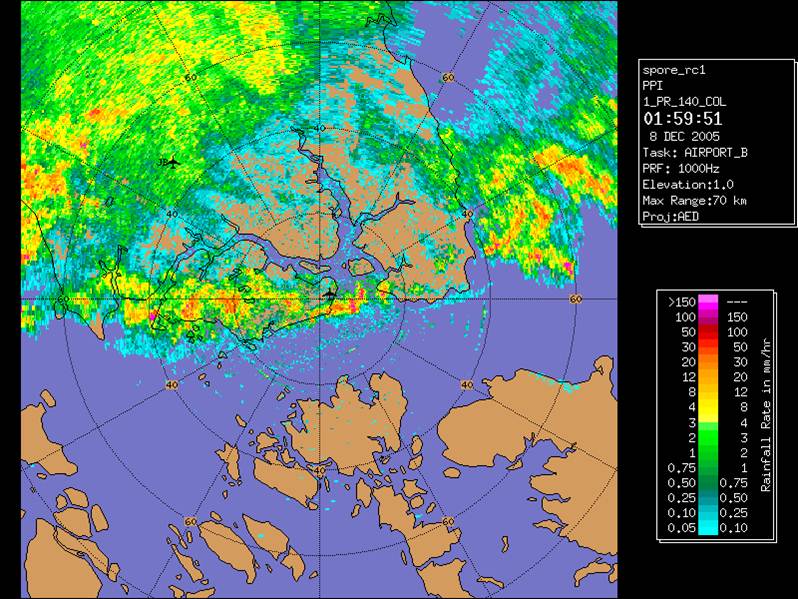 The different coloured areas on the map depicts various intensities of precipitation(rain) detected by radar
Meteorological satellites maintain a near continuous weather watch over the globe – providing information on clouds, temperature, humidity, wind and sea surface temperature, and development of weather systems such as cyclones, from hundreds to thousands of kilometers above the earth’s surface.
Satellites sense visible radiation from reflected sunlight, and invisible infrared radiation emitted from the earth’s surface and clouds. Unlike the infrared images which are available during day and night, visible images depend on reflected sunlight and are thus available only during daylight hours. A composite of an infrared image and a visible image allows cloud features to be identified more easily.
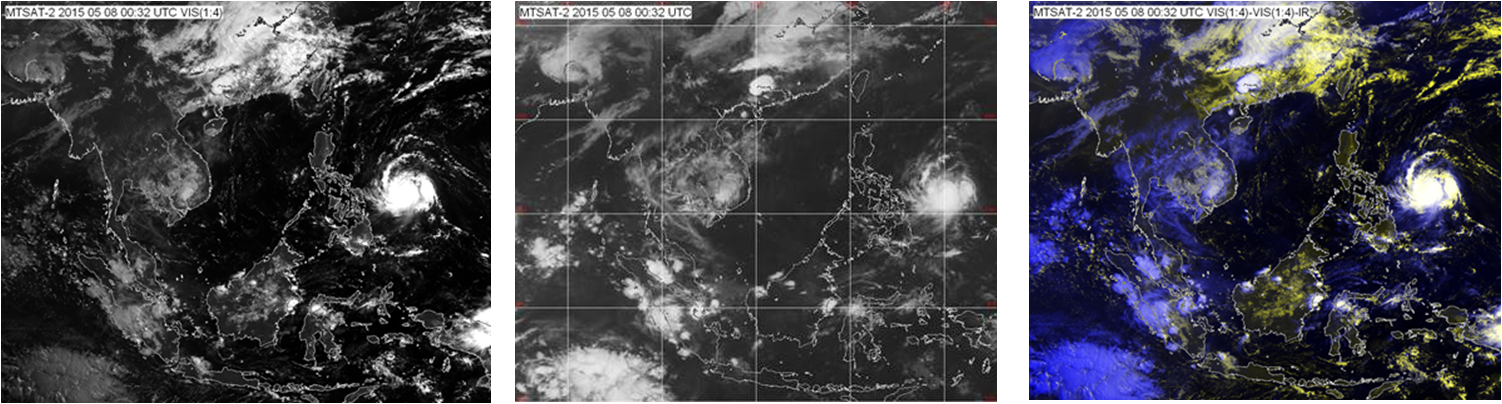 Visible image (left) available during daylight hours only; Infrared image (centre) available throughout the day; Composite image – a combination of infrared and visible images accentuates the cloud features for ease of identification.
Satellites cannot yet measure key elements such as wind and rainfall as accurately as ground-based observing systems. However they are an important source of broad scale meteorological information over the oceans and sparsely populated land areas.
Geostationary Satellites
Geostationary satellites orbit the earth above the equator at an altitude of 35,700 km. They orbit at the same speed as the earth’s rotation, so that each satellite appears stationary with respect to the rotating earth. Images from a geostationary satellite cover about one third of the earth’s surface.
MSS receives geostationary satellite data from the Japanese Himawari satellites and the Chinese Feng-Yun satellites.
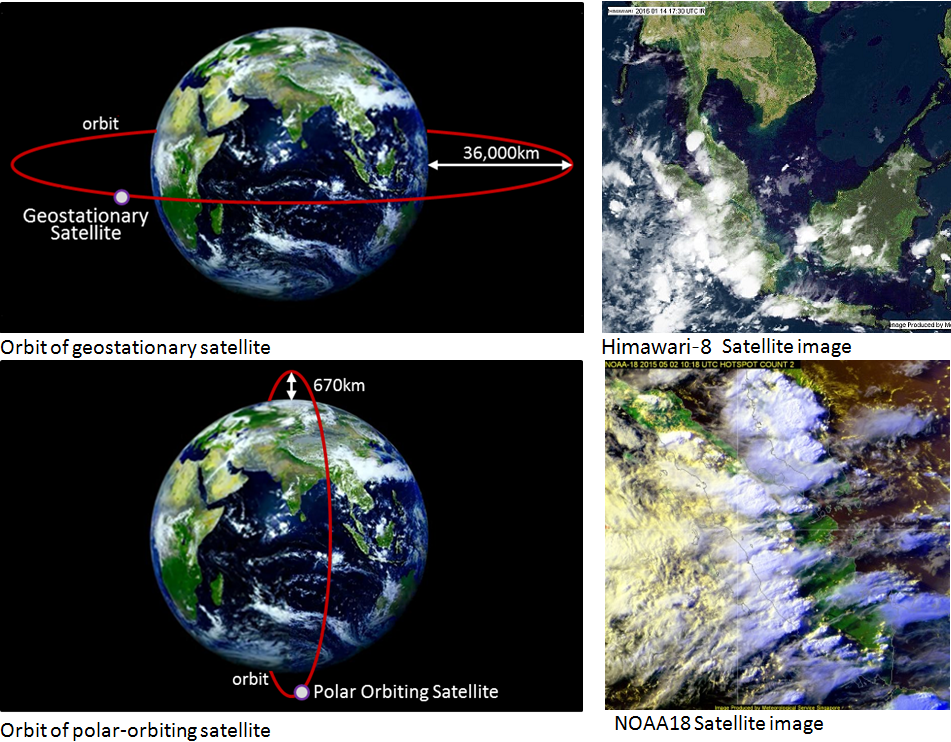
Polar-orbiting Satellites
Polar-orbiting satellites orbit at lower altitudes of around 800 km, and normally cross the equator 15 times a day. The satellites pass through a particular point on the earth’s surface twice daily at the same local time.
Due to their relatively low altitude and greater variety of onboard sensors, polar-orbiting satellites images are far more detailed (but less frequent) than those from geostationary satellites. They are used particularly for environmental monitoring of land/forest fires, smoke haze and volcanic ash.
MSS receives polar-orbiting satellite data from the US National Aeronautical and Space Administration (NASA) and National Oceanographic and Atmospheric Administration (NOAA) satellites.
The electrical current associated with each lightning strike emits electromagnetic waves that can be detected and mapped with a lightning detection system. The system detects cloud-to-ground lightning and cloud-to-cloud (intra-cloud, inter-cloud) lightning produced by thunderstorms in real time.
MSS operates a network of four ground-based lightning detection sensors located in the north, south, east and west regions of Singapore. The system detects and locates a lightning strike by means of triangulation using at least three sensors. Electromagnetic waves detected by the sensors are transmitted to a central processor that determines the location and characteristic of each lightning strike.
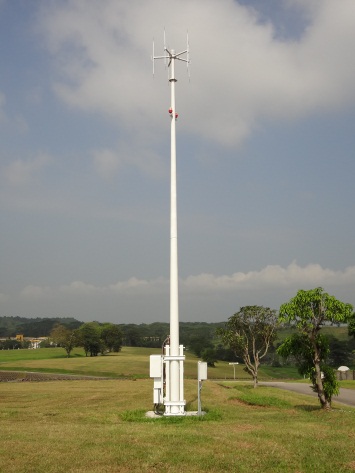 Lightning detection sensor in western Singapore, one of four sensors installed across the island