Past Climate Trends
Temperature
Singapore’s continuous temperature records since 19481 show that the island has warmed, notably in the mid-1970s when rapid urbanisation took place. Mean surface air temperature has risen by an average of 0.25°C per decade between 1948 and 2025. The upward trend is approximately double the trend in global temperatures, which occurred at a rate of 0.12°C per decade from 1951-2012. The Intergovernmental Panel on Climate Change (IPCC) in their 2013 Fifth Assessment Report state “it is extremely likely that more than half of the observed global trend was caused by anthropogenic (human-activity) increase in greenhouse gas concentrations and other anthropogenic forcings”. The higher trend over Singapore may have been due to the urbanisation, and could also be influenced by regional variations in the man-made global warming effect. Eight of the ten warmest years on record in Singapore have occurred in the 21st century and all the ten warmest years are since 1997.
[1Temperature measurements from our climate station started in 1929. After a break due to the Second World War (1942-1947), measurements began again in Jan 1948.]
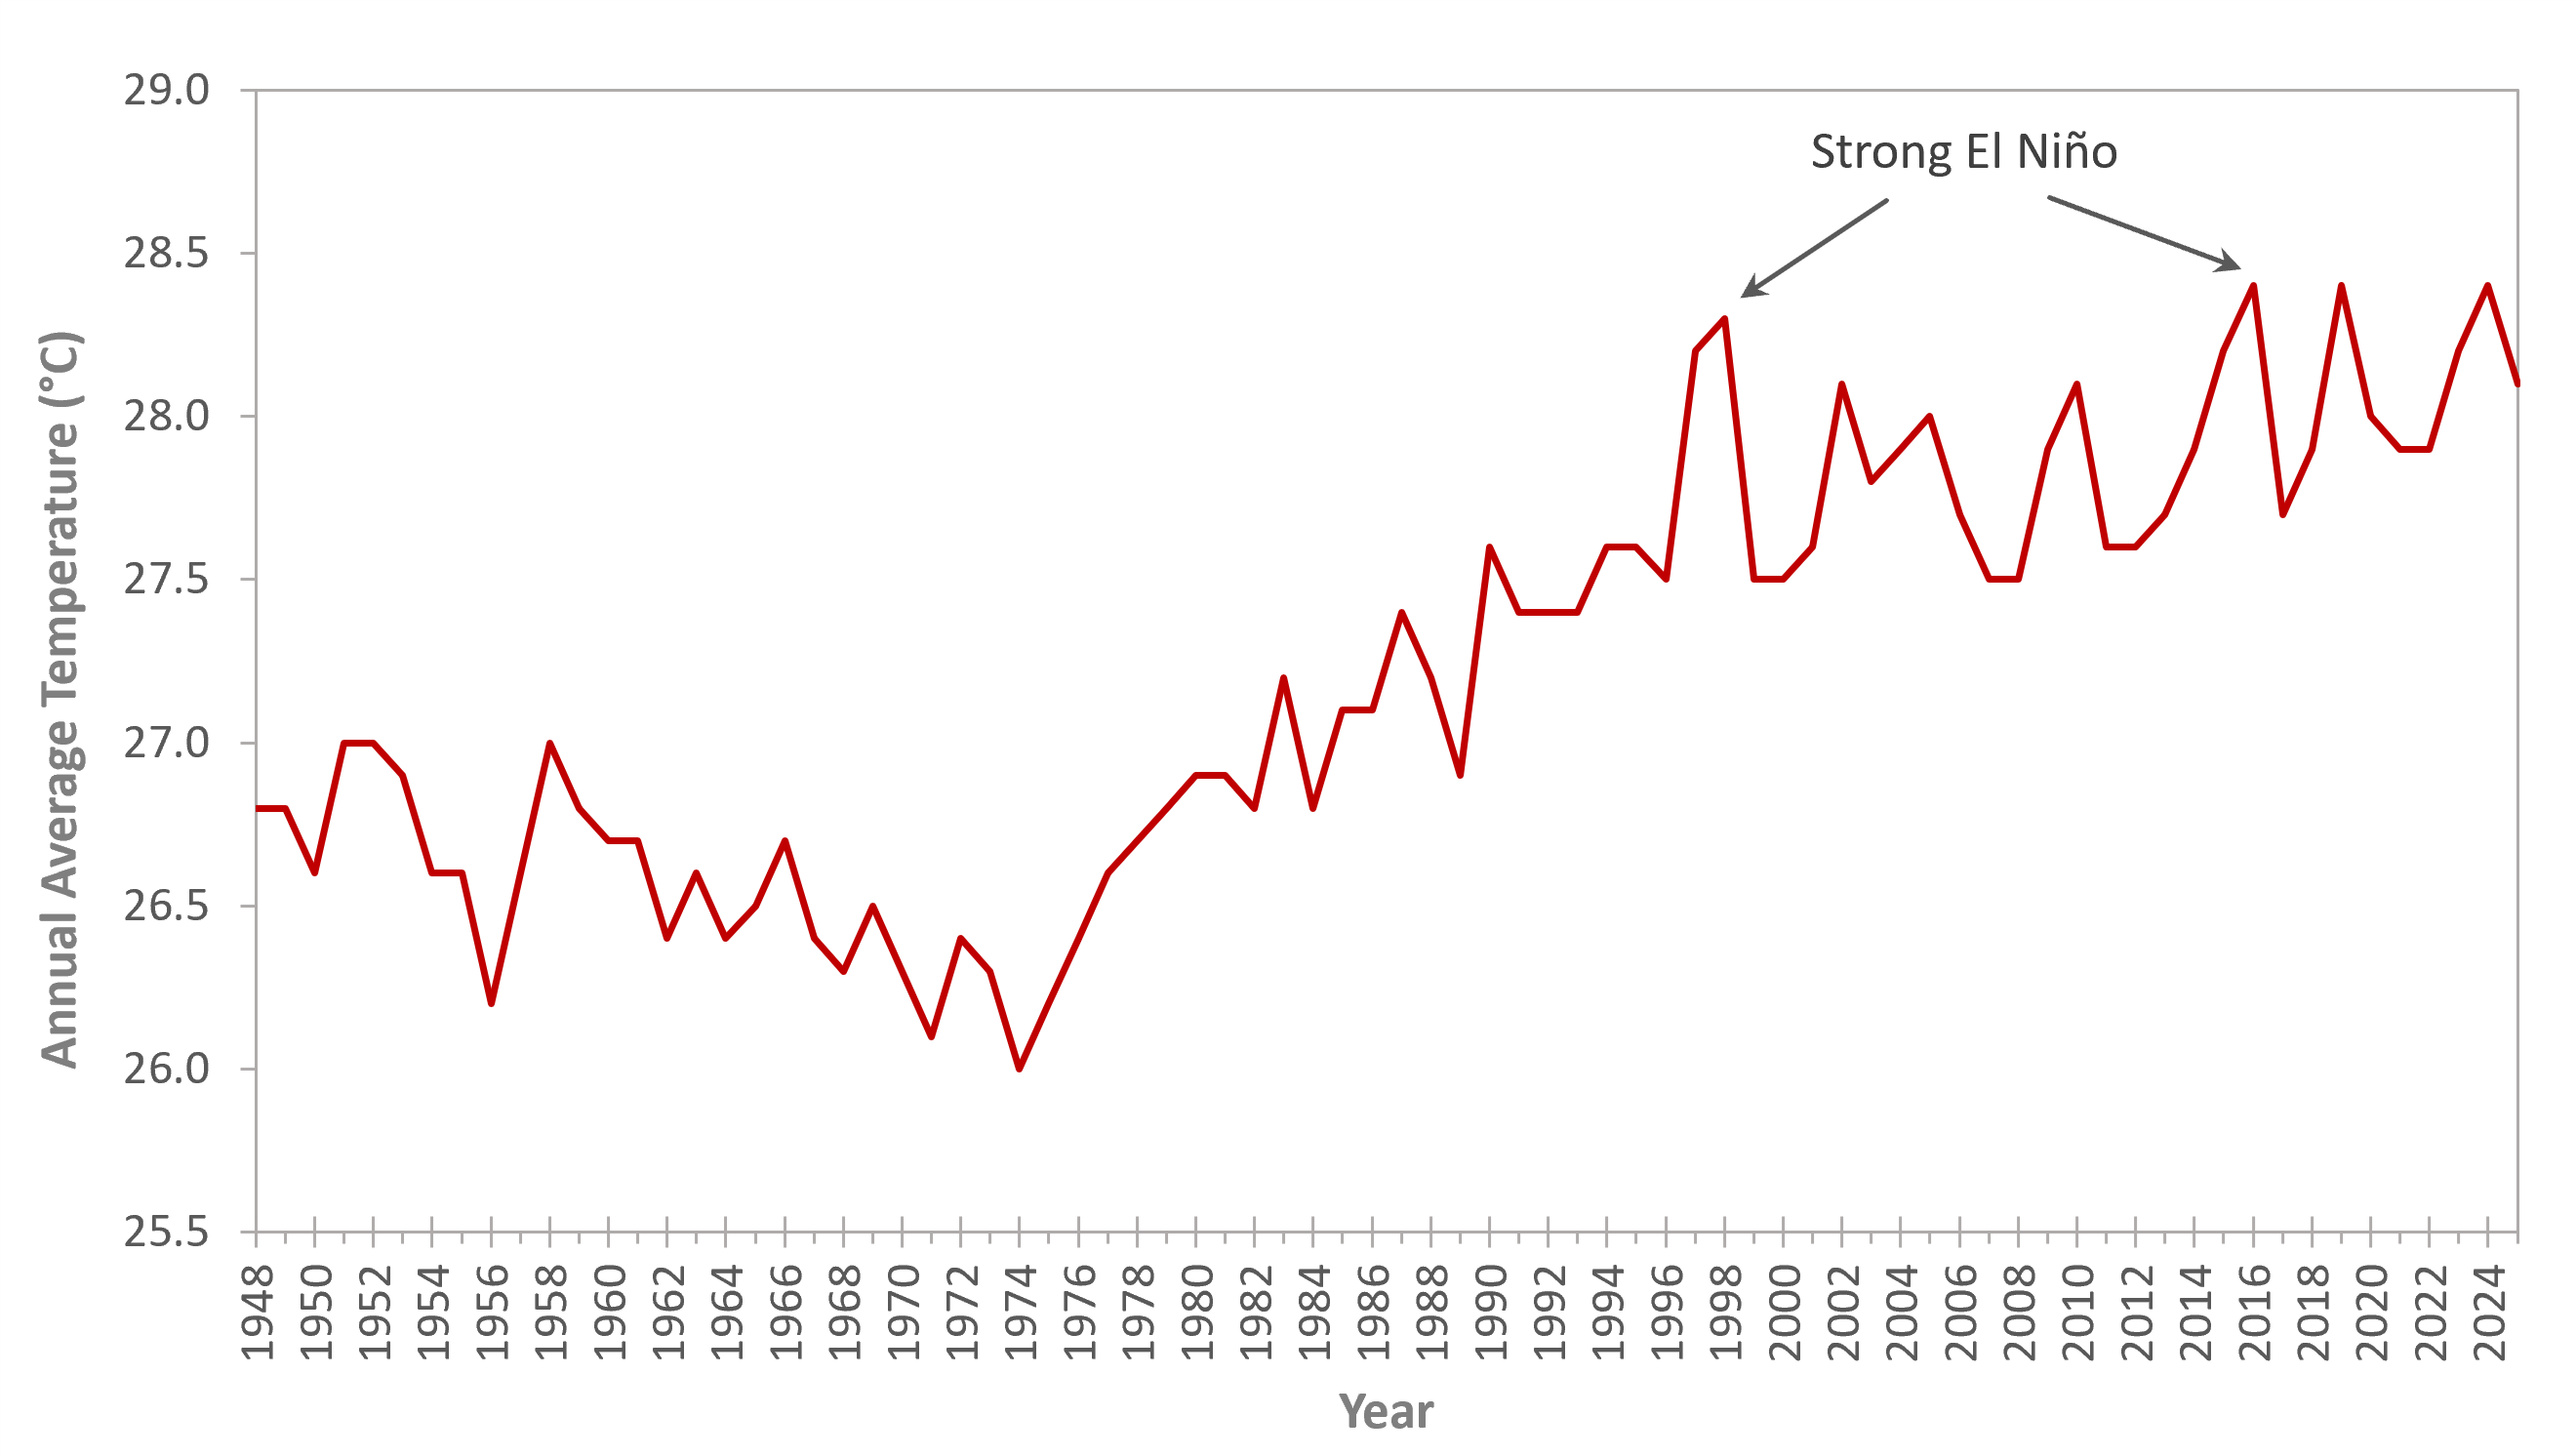 |
| Fig 1 – Annual mean temperature in Singapore from 1948 to 2025 (Data based on climate station) |
| Year | Annual Average Temperature (Degree Celsius) | |
| 2024 | 28.4 | |
| 2019 | 28.4 | |
| 2016 | 28.4 | |
| 1998 | 28.3 | |
| 2023 | 28.2 | |
| 2015 | 28.2 | |
| 1997 | 28.2 | |
| 2025 | 28.1 | |
| 2010 | 28.1 | |
| 2002 | 28.1 | |
| Table 1 – Top 10 warmest years based on long-term annual average temperatures records of our climate station from 1948-2025. | ||
Rainfall
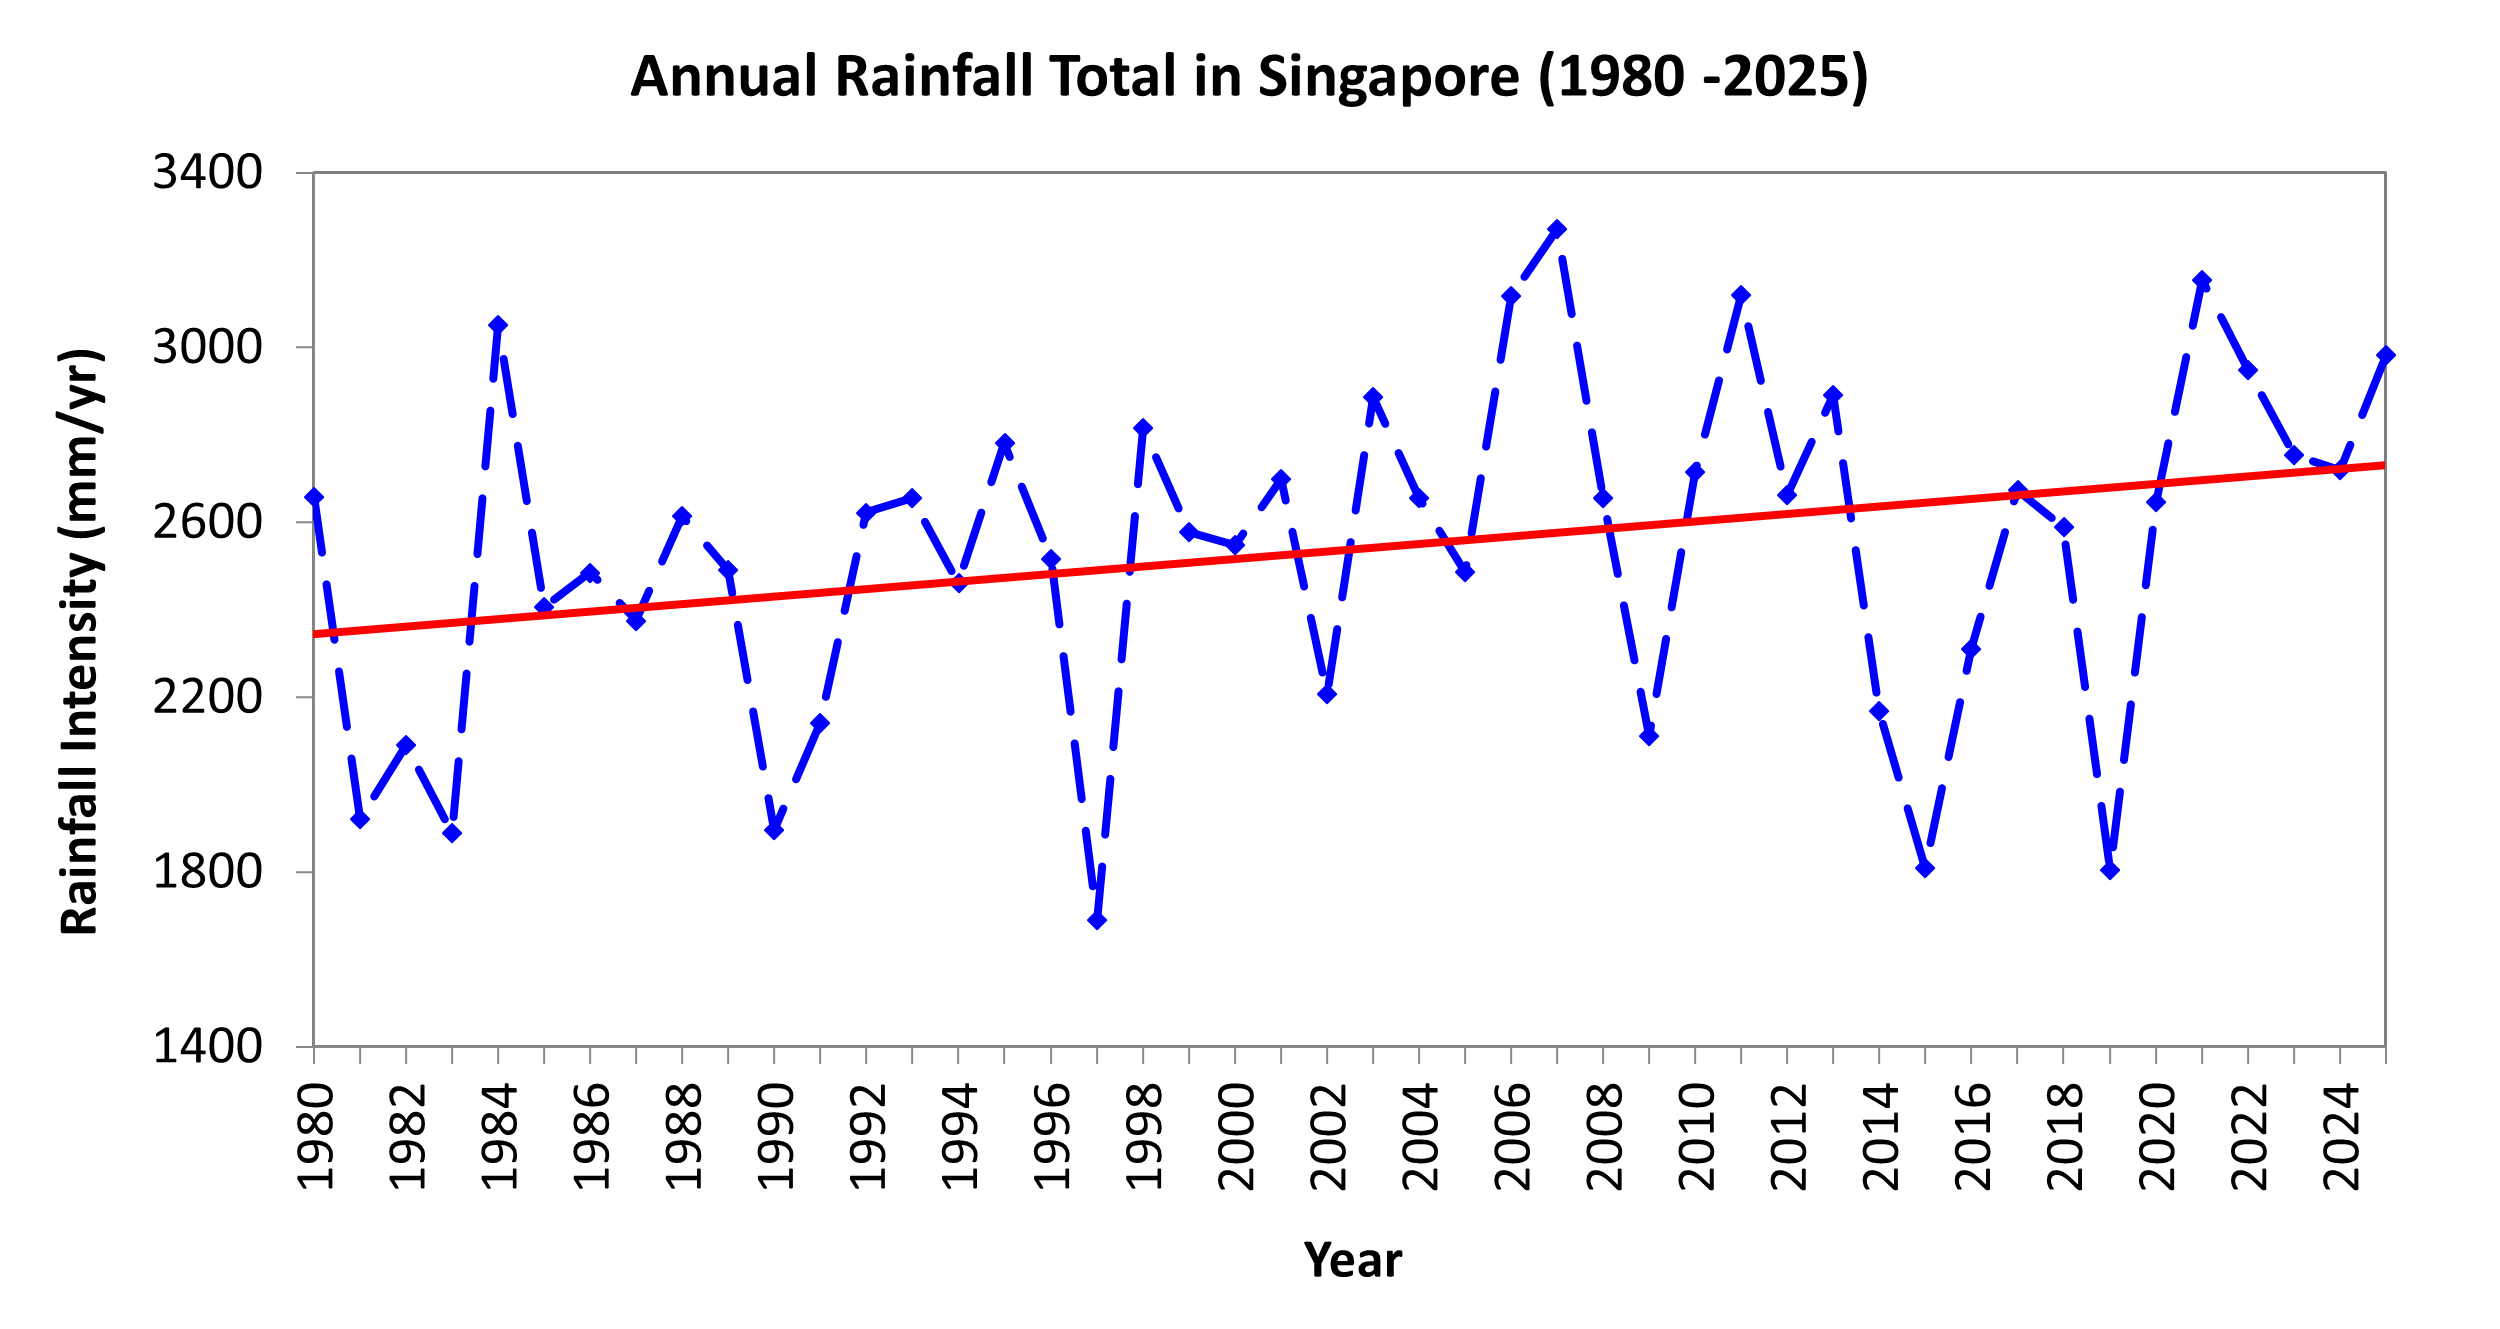
Singapore’s year-to-year rainfall is highly variable; however, on a longer term basis, annual rainfall total for Singapore since 1980 has increased at an average rate of 85.6 mm per decade.
 |
| * Data based on 23 rainfall stations across the island that have the most complete continuous records from 1980 onwards. (To account for the spatial variation in rainfall over Singapore, more stations were used for the trend analysis, but not all selected stations have records before 1980, resulting in the shorter period of available data.) |
| Fig 2 – Total annual rainfall in Singapore from 1980 to 2025 |
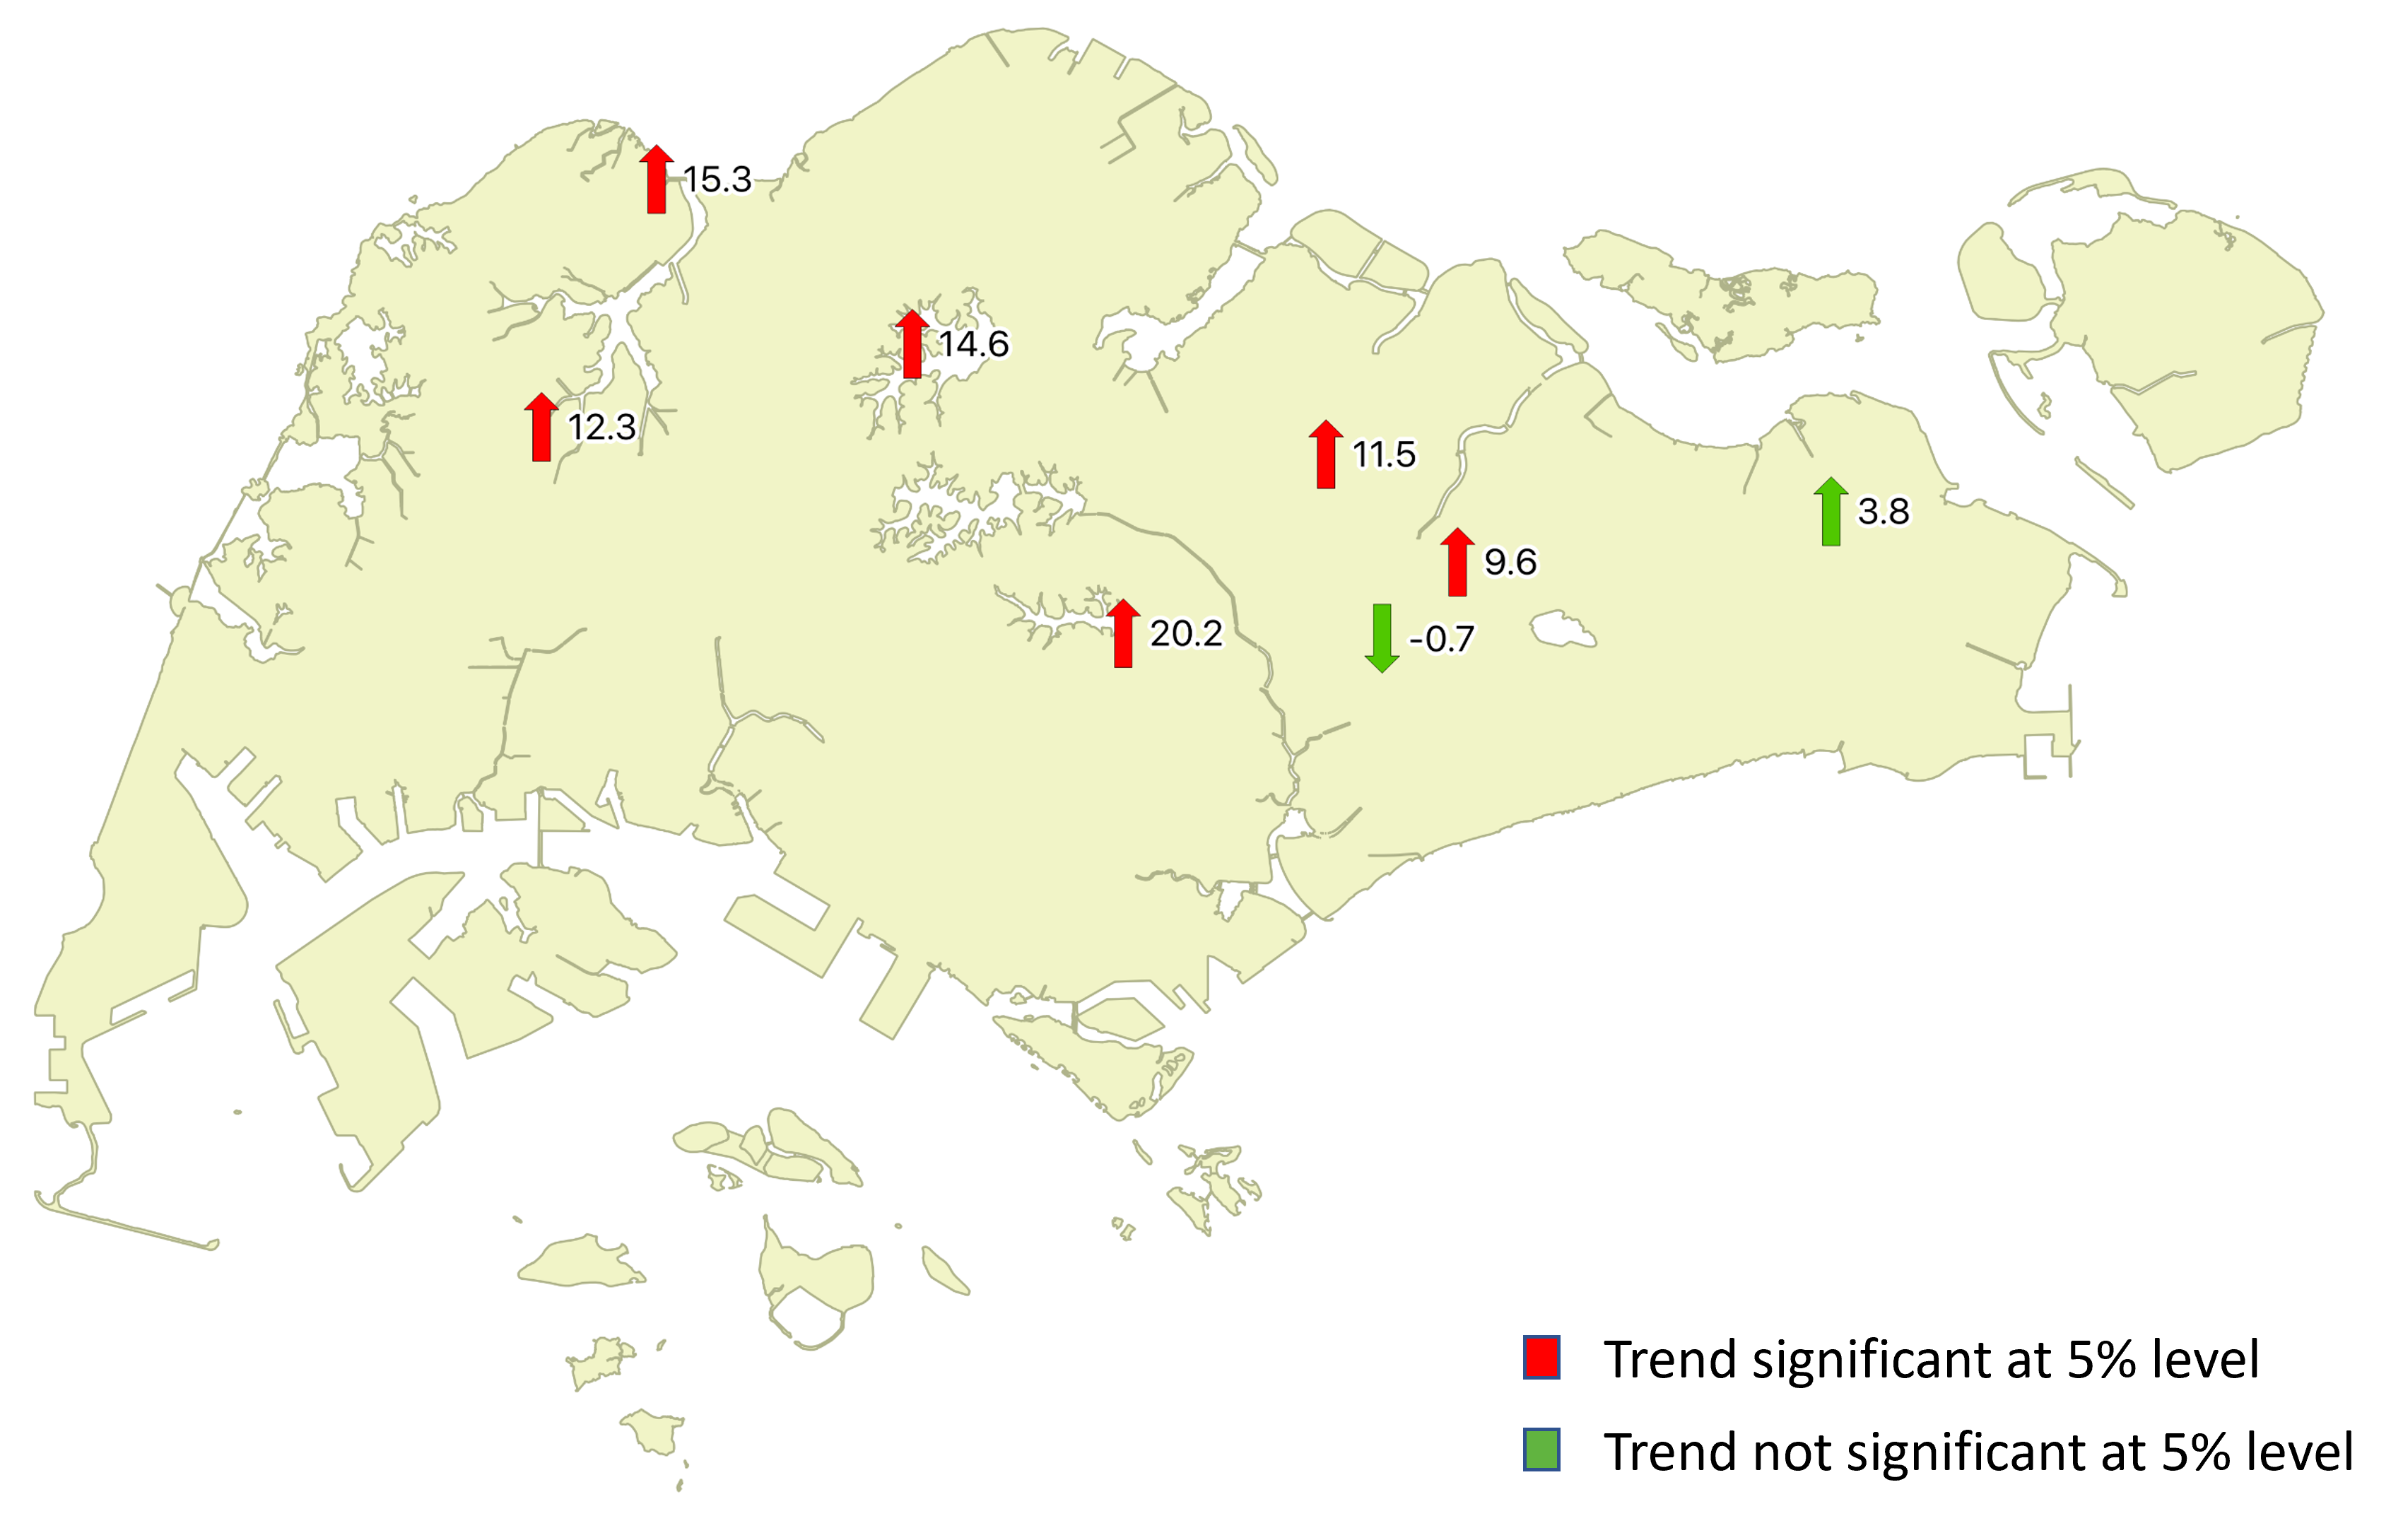 |
| Fig 3 – Map showing the past trends of annual rainfall total at individual stations. Most stations indicate upward trends (Upward and downward trends are depicted by up-arrow and down-arrow respectively). Red arrows represent statistically significant trends. The numerical value next to each arrow indicates the annual rate of change (in mm/year) for the period 1980-2025. |
| Rainfall | |
| Change per decade (1980-2025) | |
| Annual number of days with hourly rainfall totals exceeding 40 mm (heavy rain) | + 0.2 days per decade |
| Annual number of days with hourly rainfall totals exceeding 70 mm (very heavy rain) | – 0.2 days per decade |
| Table 2 – Changes in heavy rainfall occurrence in Singapore from 1980 to 2025 | |
In Singapore we have observed upward trends in the average annual rainfall and in the frequency of heavy rainfall over the past few decades. However it is not scientifically possible, using the research information that is currently available, to definitively attribute these observed rainfall changes in Singapore to global warming, natural climate variability or other effects (such as urbanisation).
Summary
Past climate trends over Singapore have shown an increase in surface air temperatures and the frequency of heavy rainfall over the past few decades. However, the climate system is complex and the past trends and the magnitude of the change will not necessarily continue into the future. Climate projections using tools like climate modelling is thus necessary to project the future climate for planning and adapting to climate change.