Climate of Singapore
Singapore is situated near the equator and has a typically tropical climate, with abundant rainfall, high and uniform temperatures, and high humidity all year round. Many of its climate variables, such as temperature and relative humidity, do not show large month-to-month variation. However, many variables exhibit prominent diurnal (or daily) variations from hour to hour, indicating the strong influence that solar heating has on the local climate.
Seasons
Singapore’s climate is characterised by two monsoon seasons separated by inter-monsoonal periods (see table below). The Northeast Monsoon occurs from December to early March, and the Southwest Monsoon from June to September. The major weather systems affecting Singapore that can lead to heavy rainfall are:
Monsoon surges, or strong wind episodes in the Northeast Monsoon flow bringing about major rainfall events;
Sumatra squalls, an organised line of thunderstorms travelling eastward across Singapore, having developed over the island of Sumatra or Straits of Malacca west of us;
Afternoon and evening thunderstorms caused by strong surface heating and by the sea breeze circulation that develops in the afternoon.
The occurrence of these events at different times of year is outlined in the following table.
|
Period |
Prevailing Winds |
Weather Features |
| Northeast Monsoon Season (December-early March) | Northerly to northeasterly winds | Early Northeast Monsoon (Wet Phase)
Late Northeast Monsoon (Dry Phase)
|
| Inter-monsoon Period (Late March-May) | Light and variable, interacting with land and sea breezes |
|
| Southwest Monsoon Season (June-September) | Southeasterly to southerly |
|
| Inter-monsoon Period (October-November) | Light and variable, interacting with land and sea breezes |
|
Rainfall
Rainfall is plentiful in Singapore and it rains an average of 171 days1 of the year. Much of the rain is heavy and accompanied by thunder. The 1991-2020 long-term mean annual rainfall total is 2113.3mm.
[1 A day is considered to have “rained” if the total rainfall for that day is 0.2mm or more.]
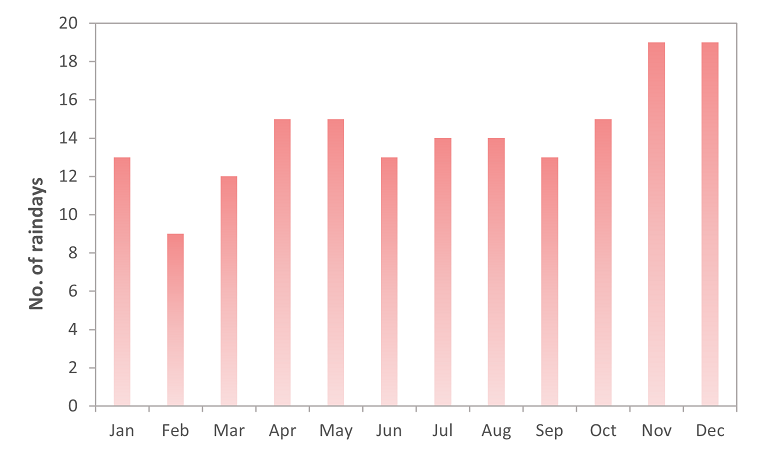 |
Fig 1 – Average number of rain days per month (1991-2020).
* Data from Changi Climate Station
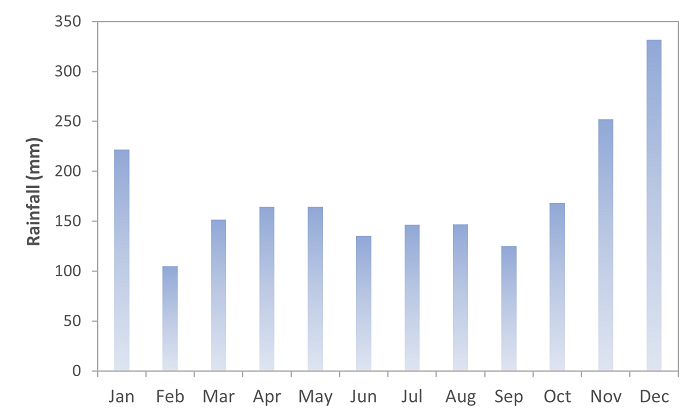 |
Fig 2 – Monthly rainfall for Singapore (mm) (1991-2020)
* Data from Changi Climate Station
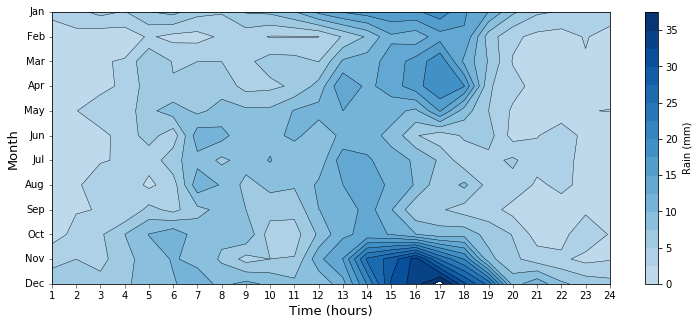 |
Fig 3 – Hourly variation of rainfall for each month (1991-2020).
* Data from Changi Climate Station
While there is no distinct wet or dry season in Singapore, monthly variations in rainfall do exist. Higher rainfall occurs from November to January during the wet phase of Northeast Monsoon season (Figs. 1 – 3), when the major tropical rain-belt (the Intertropical Convergence Zone ITCZ) is positioned near to us. The driest month is February which is during the dry phase of the Northeast Monsoon when the rain-belt has moved further south to affect Java.
Rainfall in Singapore shows a marked diurnal variation (Fig 3), with rainfall occurring more frequently during the daytime, particularly in the afternoons when solar heating is strongest. In terms of spatial distribution, rainfall is higher over the central and western parts of Singapore and decreases towards the eastern part of the island (Fig 4).
 |
Fig. 4 Annual average rainfall distribution (1991-2020)
Temperature
Fig 5 – Mean monthly temperature variation (ºC) (1991-2020)
* Data from Changi Climate Station
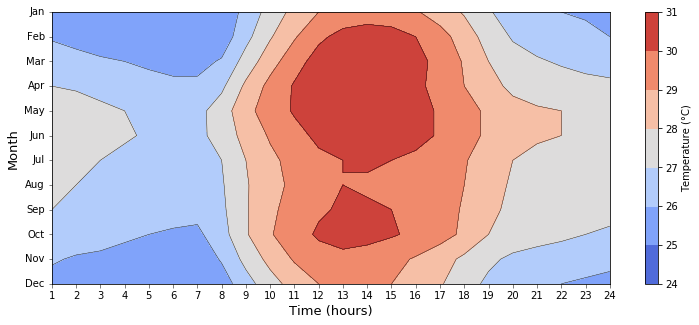 |
Fig 6 – Hourly variation of temperature for each month (1991-2020)
* Data from Changi Climate Station
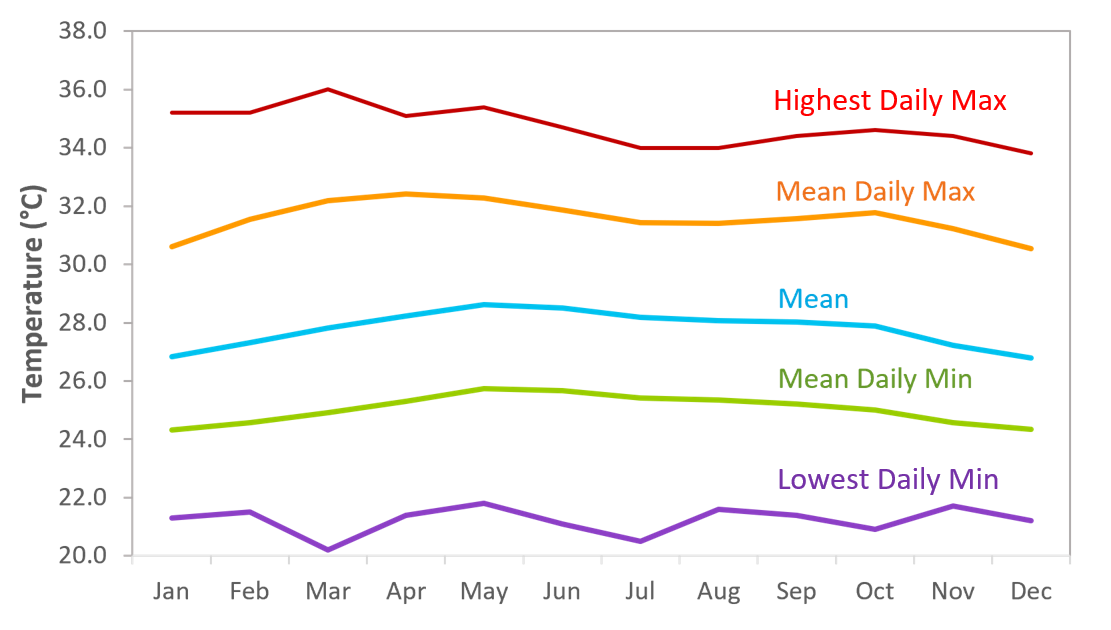
Compared to countries in the temperate regions, temperatures in Singapore vary little from month to month and also from day to day. The daily temperature range has a minimum usually not falling below 23-25ºC during the night and maximum not rising above 31-33ºC during the day. May has the highest average monthly temperature (24-hour mean of 28.6ºC) and December and January are the coolest (24-hour mean of 26.8ºC). Singapore, being an island, also has a coastal climate. The proximity of the sea has a moderating influence on its climate. This is because water has a larger heat capacity than the land surface, and a greater amount of heat is required to increase the sea temperatures. During afternoons, conditions at the coast are often relieved by sea breezes. The presence of significant wind speeds, rainfall and cloud cover are the most important natural influences in mitigating the tropical heat.
Humidity
Relative humidity shows a fairly uniform pattern throughout the year and does not vary much from month to month (Fig 7). Its daily variation is more marked, varying from more than 90% in the morning just before sunrise and falling to around 60% in the afternoon on days when there is no rain. The mean annual relative humidity is around 82%. Relative humidity frequently reaches 100% during prolonged periods of rain.
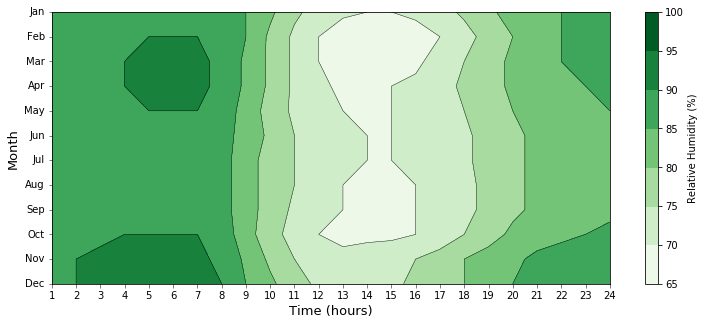 |
Fig 7 – Hourly variation of relative humidity for each month (1991-2020)
* Data from Changi Climate Station
Surface Wind
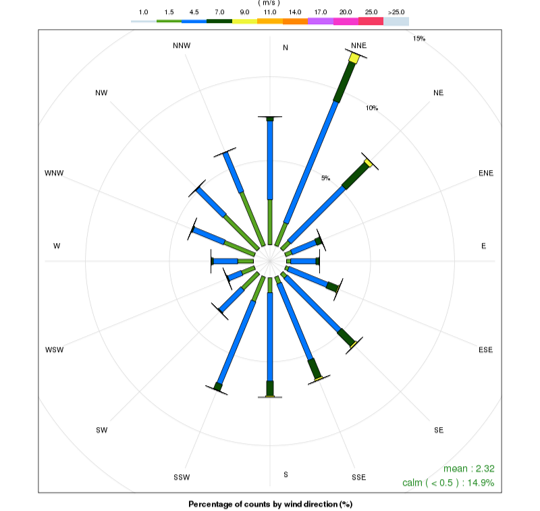 |
Fig 8 – Annual wind rose (m/s) (1991-2020)
* Data from Changi Climate Station
In Singapore, winds are predominantly from the northeast and the south, indicative of the dominant monsoons that influence the region (refer to Fig 8 for the wind rose). Typically, on any given day, wind patterns align with the dominant monsoon flow, except when influenced by terrain or weather phenomena such as showers, thunderstorms, and local breezes (land or sea). During the Northeast Monsoon season (December to March), winds generally blow from the northerly to northeasterly direction, while the Southwest Monsoon (June to September) generally sees winds blowing from the southeasterly to southerly direction (Fig 9). Notably, wind strength tends to be stronger during the Northeast Monsoon. The inter-monsoon months (April, May, October, and November) serve as transitional periods between the monsoons, characterised by light and variable winds.
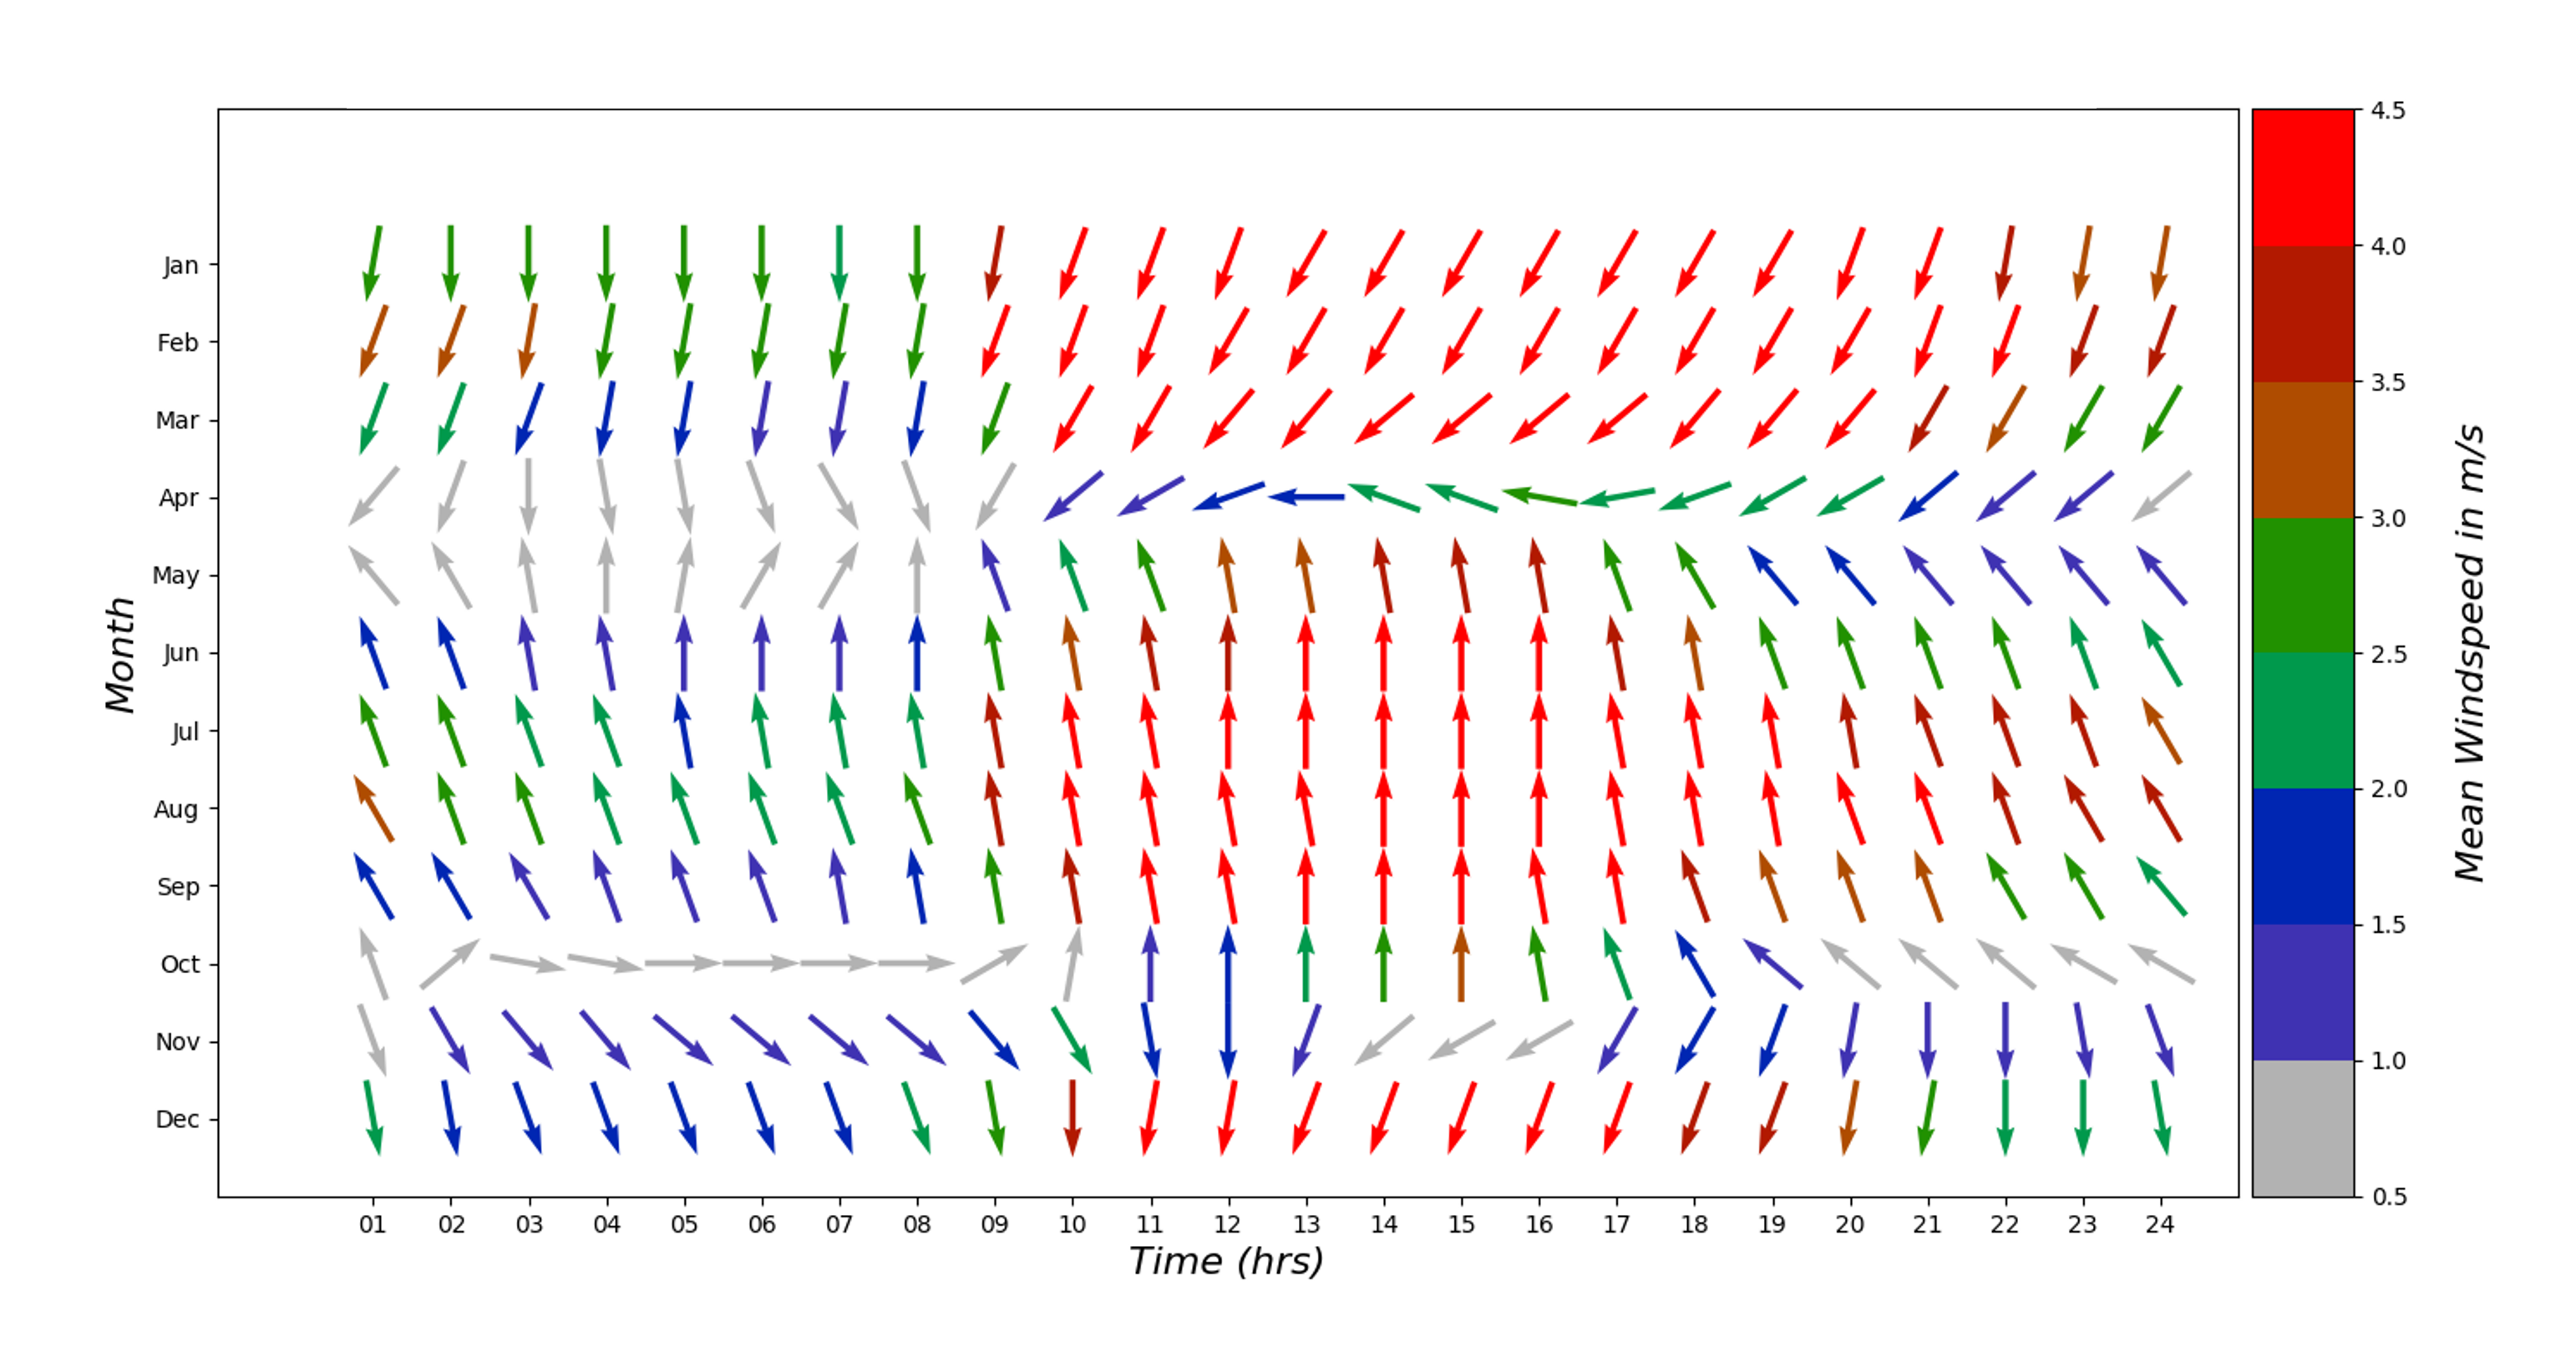 |
Fig 9 – Hourly variation of surface wind speed (m/s) and direction for each month (1991-2020 average).
Shows a compilation of the monthly and hourly variation of surface wind over the course of the year. Arrow colours denote wind strength and arrow direction shows the direction the wind is blowing from.
* Data from Changi Climate Station
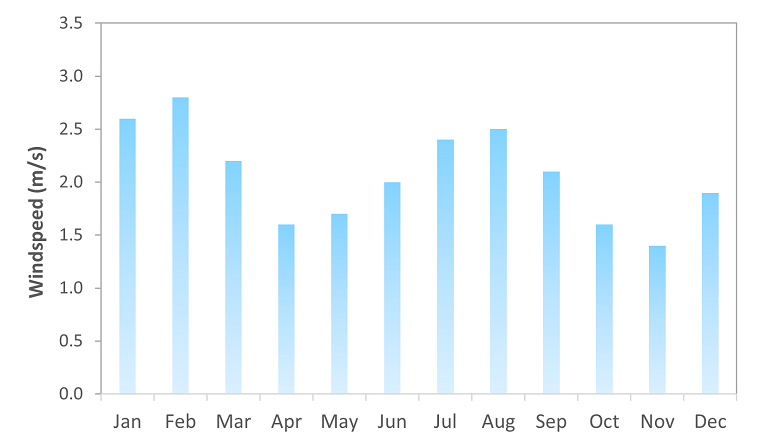 |
Fig 10 – Average monthly surface wind speed (m/s) (1991-2020).
* Data from Changi Climate Station
Generally, daytime winds tend to be stronger compared to nighttime winds (Fig 9). In Singapore, winds are generally light, with mean surface wind speed of around 2 m/s. The strongest winds occur during the Northeast Monsoon, specifically in January and February (Fig 10). During the Northeast Monsoon surge, mean wind speeds can reach up to 10 m/s or more. Another occurrence of heightened wind activity is associated with thunderstorms, where surface wind gusts are commonly triggered by either the downdrafts of the thunderstorm or the passage of Sumatra squall lines.
Visibility
Visibility is generally good during the Northeast Monsoon months from December to March except during rainfall or showers. Slight to moderate haze, which is common during the Southwest Monsoon and in light wind conditions during the inter-monsoon months, can reduce the visibility to below 10 kilometres. During severe episodes of transboundary smoke haze, visibilities below 1 km have been recorded. Poor visibility is also often observed between 0500hr and 0900hr in light to calm wind conditions when mist forms. Visibility, however, usually improves quickly within a few hours after sunrise when the mist dissipates. Following a few hours of rain, poor visibility is also sometimes observed, particularly in almost calm wind conditions.
Sunshine Duration
Sunshine duration refers to the cumulative time during which an area receives direct irradiance from the sun of at least 120 Watts/m2. Since Singapore is near the equator, the length of its day is relatively constant throughout the year, and thus so is the amount of sunshine it receives. Daily sunshine hours are mainly influenced by the presence or absence of cloud cover. February and March have the highest sunshine hours, while November and December have the lowest (Figs 11 – 12).
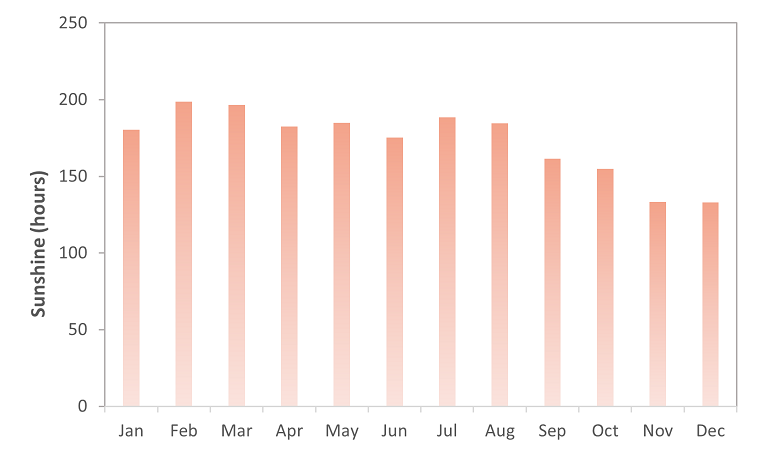 |
Fig 11 – Average monthly sunshine hours (1991-2020).
* Data from Changi Climate Station
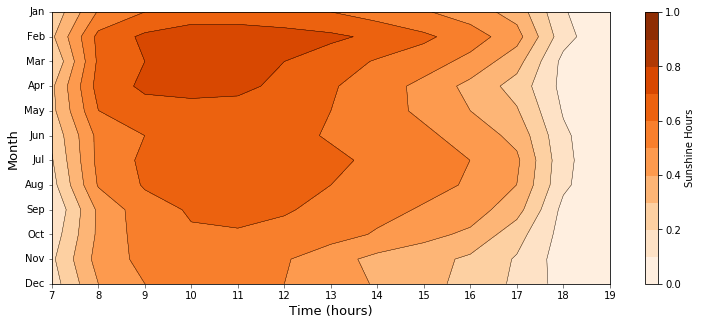 |
Fig 12 – Hourly variation of sunshine hours for each month (1991-2020).
* Data from Changi Climate Station
Cloud Cover
Cumulus, stratocumulus and cumulonimbus clouds are the most common low cloud types in Singapore. On an average day, cumulus clouds start to develop in the mid-morning, increasing to about 3-4 oktas (one okta is one eighth of the sky) by midday with bases of around 2,000 ft (0.6 km) and tops from 8,000 to 12,000 ft (~ 2.5 – 3.5 km). During the afternoon and early evening, these cumulus clouds may develop into cumulonimbus clouds with tops reaching between 30,000 and 40,000 ft (9 – 12 km).
The clouds diminish and begin to flatten into stratiform layers by dusk and slowly disperse during the night. Weather systems act to intensify or reduce this diurnal cycle of cloud development. Overcast conditions caused by extensive middle to high layer clouds together with active cumulus and cumulonimbus clouds are often experienced during the passage of a “Sumatra” squall line
During a Northeast Monsoon surge, broken to overcast medium layer clouds occur together with large cumulus clouds producing prolonged widespread rain and intermittent bouts of heavy rain. Low stratus clouds with bases below 1,000 ft (0.3 km) are frequently observed following the passage of Sumatra squall lines and during Northeast Monsoon surges.
Records of Climate Station Means (Climatological Reference Period: 1991-2020)
|
Jan |
Feb |
Mar |
Apr |
May |
Jun |
Jul |
Aug |
Sep |
Oct |
Nov |
Dec |
||
|
Rainfall |
Mean Monthly/ |
221.6 |
105.1 |
151.7 |
164.3 |
164.3 |
135.3 |
146.6 |
146.9 |
124.9 |
168.3 |
252.3 |
331.9 |
|
Mean |
13 |
9 |
12 |
15 |
15 |
13 |
14 |
14 |
13 |
15 |
19 |
19 |
|
|
Temperature (°C) |
Mean |
30.6 |
31.5 |
32.2 |
32.4 |
32.3 |
31.9 |
31.4 |
31.4 |
31.6 |
31.8 |
31.2 |
30.5 |
|
Mean |
24.3 |
24.6 |
24.9 |
25.3 |
25.7 |
25.7 |
25.4 |
25.3 |
25.2 |
25.0 |
24.6 |
24.3 |
|
|
24-hr |
26.8 |
27.3 |
27.8 |
28.2 |
28.6 |
28.5 |
28.2 |
28.1 |
28.0 |
27.9 |
27.2 |
26.8 |
|
|
Relative Humidity (%) |
Mean |
94.7 |
93.7 |
94.5 |
95.6 |
95.2 |
93.7 |
93.3 |
93.0 |
93.8 |
95.2 |
96.5 |
96.0 |
|
Mean |
66.0 |
62.1 |
61.4 |
62.3 |
63.7 |
63.4 |
64.1 |
63.6 |
62.2 |
61.4 |
65.5 |
68.0 |
|
|
24-hr |
83.5 |
81.2 |
81.7 |
82.6 |
82.3 |
80.9 |
80.9 |
80.7 |
80.7 |
81.5 |
84.9 |
85.5 |
|
|
Wind Speed (m/s) |
Mean |
2.6 |
2.8 |
2.2 |
1.6 |
1.7 |
2.0 |
2.4 |
2.5 |
2.1 |
1.6 |
1.4 |
1.9 |
|
Thunderstorm |
Mean |
6 |
5 |
12 |
20 |
19 |
15 |
13 |
13 |
14 |
17 |
19 |
14 |
|
Mean |
7 |
4 |
13 |
21 |
21 |
16 |
13 |
12 |
12 |
18 |
22 |
16 |

