Climate
- Share this page


Climate refers to the general weather conditions prevailing over an area for a long period
Climate is a statistical and aggregate study of past weather conditions over a number of years — from decades to centuries. Weather, on the other hand, comprises the day-to-day changes in temperature, humidity, rainfall and wind that we experience.
Climate is often expressed in terms of months and seasons while weather is measured by days and weeks. While it is possible to provide weather forecasts, it is only possible to provide general projections for climate due to the wide time scales and uncertainties involved.
Please refer to this link or watch Let’s Ask MSS! to find out more.
Let’s Ask MSS!
Climate varies on multiple timescales due to both natural causes and anthropogenic
influences. Natural causes include the climatic response to volcanic eruptions and
the varying radiative input from the Sun. It also includes the local manifestation
of planetary scale climate variability. The El Niño Southern Oscillation (ENSO) is
an example of particular relevance to the region. During El Niño and La Niña events,
Singapore generally receives less and more rainfall than average respectively.
Future changes in ENSO could substantially change droughts affecting the region.
Natural variability also occurs on longer decadal and multi-decadal timescales and
this can also influence the climatic conditions in the Singapore region.
Based on 28 observation stations across Singapore, there was an increasing trend in
annual average rainfall since 1980. However, the few station observational records
that extend back to the 1950s show that the rainfall had a downward trend from the
1950s to 1970s. This illustrates the importance of inter-decadal variability and
emphasizes that not all long-term trends in climate are due to anthropogenic climate
change. When looking at future climate it will often be a combination of these
natural signals, along with the anthropogenic climate change signal, that will be
important.
According to World Meteorological Organisation (WMO) guidelines, a climate station
monitors the climate over a long-term period, in order to provide data that enables
detection of climate change signals at the national level. It should minimally have
30 years of rainfall and temperature data, and be located relatively far away from
large urban centres.
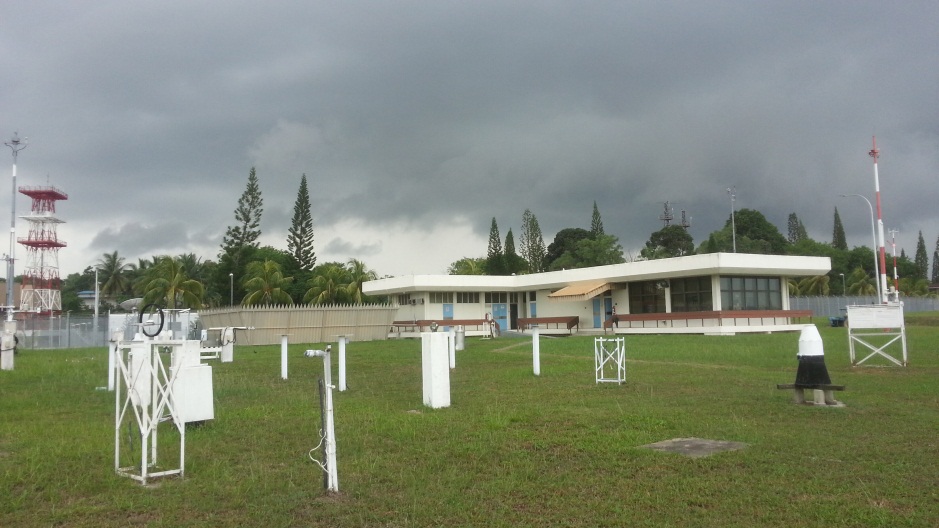 Singapore’s Climate Station at Changi
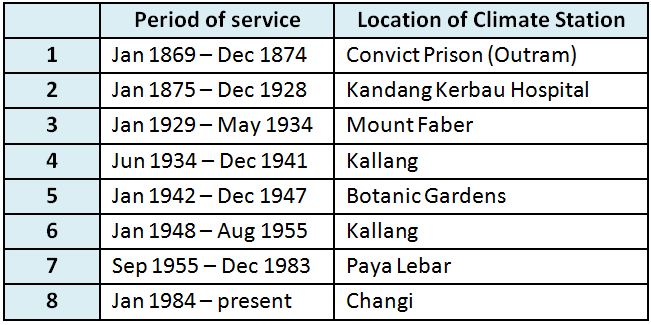
Singapore’s climate station has been located at several different sites in the past
140 years. The station had been decommissioned at various points in the past due to
changes to local land use in the site’s vicinity, and had to be relocated. Since
1984, the climate station has been located at Changi.
Please refer to this link.
As a follow-up on Singapore’s Second National Climate Change Study (V2) released in
2015, Singapore’s Third National Climate Change Study (V3) provides high-resolution
climate change projections for Singapore and the wider Southeast Asia region by
dynamically downscaling coarse resolution global climate model simulations from the
latest Inter-governmental Panel on Climate Change (IPCC) 6th Assessment Report
(AR6).
Undertaken by the Centre for Climate Research Singapore under the Meteorological
Service Singapore, V3 represents a significant advancement in climate change science
for Singapore and the Southeast Asia region.
The details of the climate projections are published on the V3 Data Visualisation
Portal.
The atmosphere and ocean interact, with the tropical atmosphere-ocean system varying
on different time scales. An important climate phenomenon with inter-annual or
year-to-year variability is the El Niño and La Niña, which are opposite phases of
what is known as the El Niño-Southern Oscillation (ENSO). In the
absence of an El Niño or La Niña, the ENSO is in a neutral phase.
Under normal conditions, the prevailing trade winds “push” the surface water in the
tropical Pacific Ocean westward, causing upwelling of cold subsurface water off the
coast of Peru in South America. During El Nino episodes, the appearance of warmer
than normal sea surface temperatures over the eastern tropical Pacific is
accompanied by a reduction of the sea-level pressure gradient that drives the trade
winds. The trade winds are weakened and upwelling of cold water off the coast of
Peru is reduced, thus reinforcing the initial warming in the eastern tropical
Pacific. La Nina episodes are the reverse, with a sustained cooling and
strengthening of trade winds in these same areas.
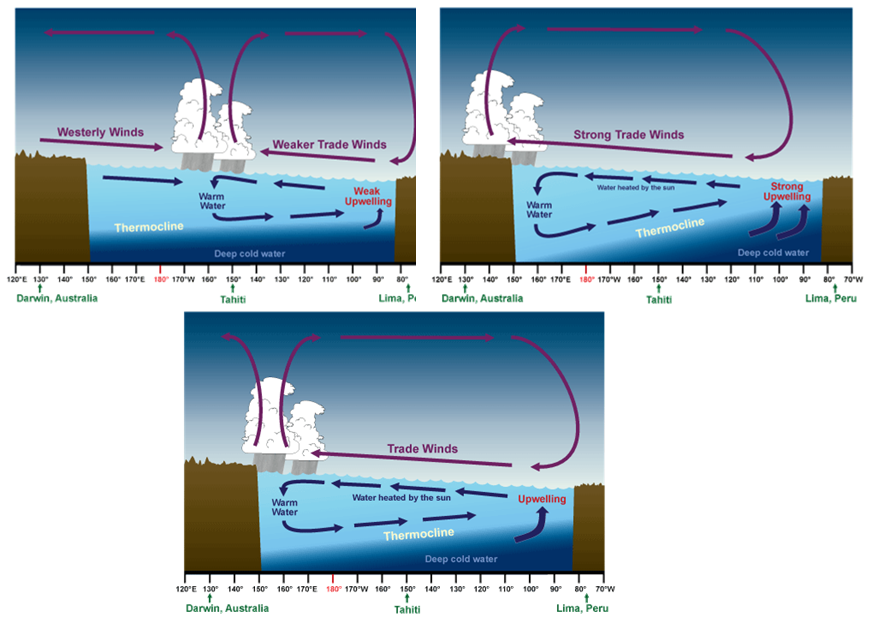 Cross sections of El Niño (left), La Niña (right), and ENSO Neutral (neither El Niño nor La Niña conditions) (above) across the Tropical Pacific Ocean (Image credit: NOAA)
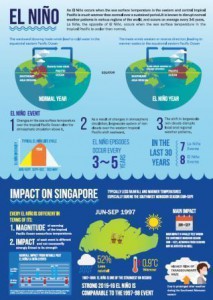
El Niño episodes typically last about a year, but some may last longer. They usually
start to form during the northern hemisphere summer and reach peak strength during
winter. As the El Niño peaks, the tropical Pacific Ocean overall is warmer than
normal and the near surface air temperature warms up as the ocean gives up heat to
the atmosphere. As the ocean has a much larger capacity than the atmosphere, it
responds much more slowly to forcing from the fast changing atmospheric system. The
huge difference in response times leads to self-sustaining oscillations in the
tropical Pacific which peak every 3-5 years on average, producing the El Nino/La
Niña phenomena.
ENSO is a primary cause for climate anomalies (departures from normal conditions) in
many parts of the world. During El Niño episodes, the weakening and even reversal of
the normal pattern of rising moist air over tropical Asia and sinking air over the
eastern Pacific alters the normal wind circulation in the tropical regions. The
shift in tropical convection results in prolonged drier and warmer than normal
conditions in many parts of Southeast Asia including Singapore. The effect is
reversed during La Niña episodes, which typically bring wetter than normal
conditions to the region.
Certain shorter term variations in the tropical atmosphere-ocean system play a
critical part in major oscillations. An example of such phenomena with
intra-seasonal or month-to-month variability is the Madden-Julian Oscillation (MJO).
The MJO is characterised by an eastward propagation of clouds and rainfall over the
tropical regions from the Indian Ocean to the western Pacific Ocean, with a period
of between 30 and 60 days on average. The MJO consists of two phases – an enhanced
rainfall (convection) phase and a suppressed rainfall phase.
 Animation of the Madden-Julian Oscillation shows active areas of convection travelling from west to east close to the equator with a period of 30-60 days. A significant percentage of rainfall in the tropics occurs during the active convection phases of the MJO (Image credit: Adrian Matthews, University of East Anglia, United Kingdom)
The changes in rainfall associated with the different phases of MJO impact the
weather in the tropics. A significant percentage of rainfall in the tropics occurs
during the active convection phases of this cycle. The MJO is thus important for
extended-range weather prediction over our region. The MJO can also modulate the
strength of the monsoons and tropical cyclones.
The Indian Ocean Dipole or IOD is a major climate driver in the Indian Ocean, and is
sometimes likened to the Indian Ocean’s counterpart of the Pacific Ocean’s El Nino
Southern Oscillation (ENSO). The IOD refers to a broad pattern of year-to-year sea
surface temperature (SST) changes in the tropical western and eastern Indian Ocean.
Like the ENSO, the IOD varies between three phases: positive, neutral and negative.
On average, each phase occurs about every 3 to 5 years. The IOD is monitored by an
index that measures the difference in area-averaged SSTs between the western and
eastern Indian Ocean regions shown below.
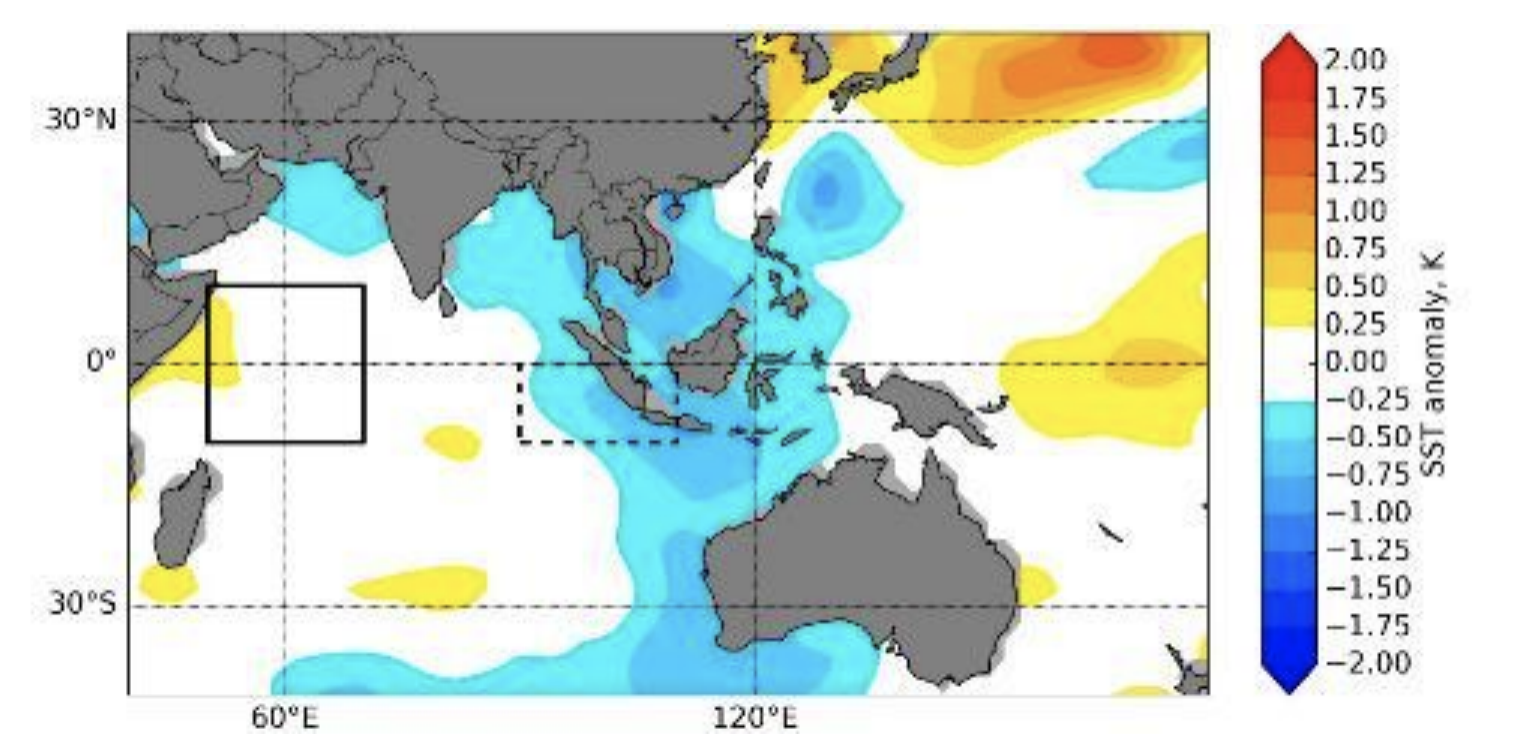 IOD is monitored by an index that
measures the difference in SSTs between the western Indian Ocean (solid
black box) and eastern Indian Ocean (dotted black box).
In the neutral phase, SSTs are close to normal across the whole basin as warm water
flows through Indonesia from the western Pacific and into the eastern Indian Ocean.
The air above this region rises and descends over the western half of the Indian
Ocean with westerly winds blowing back along the equator.
During a negative IOD phase, the westerly winds intensify, causing warm water to
concentrate in the eastern half of the Indian Ocean. As a result, the SSTs become
warmer than usual near Indonesia and cooler in the western Indian Ocean near
Somalia. A negative IOD phase tends to bring more rainfall to our surrounding
region.
 Animation of the negative phase of the Indian Ocean Dipole.
During a positive IOD phase, the westerly winds weaken and sometimes easterly winds
form. This allows warm water to flow towards east Africa and reverses the SST
anomaly pattern in the tropical Indian Ocean with warmer SSTs in the western half of
the basin and cooler SSTs in the eastern portion. A positive IOD often results in
less rainfall over the region from Indonesia to Australia, sometimes contributing to
drought.
 Animation of the positive phase of the Indian Ocean Dipole.
Positive or negative IOD events tend to begin in May or June, peak between August
and October before rapidly decaying prior to the onset of the monsoon in late
November or early December.