EI Niño/La Niña Status
Updated on 17 April 2026
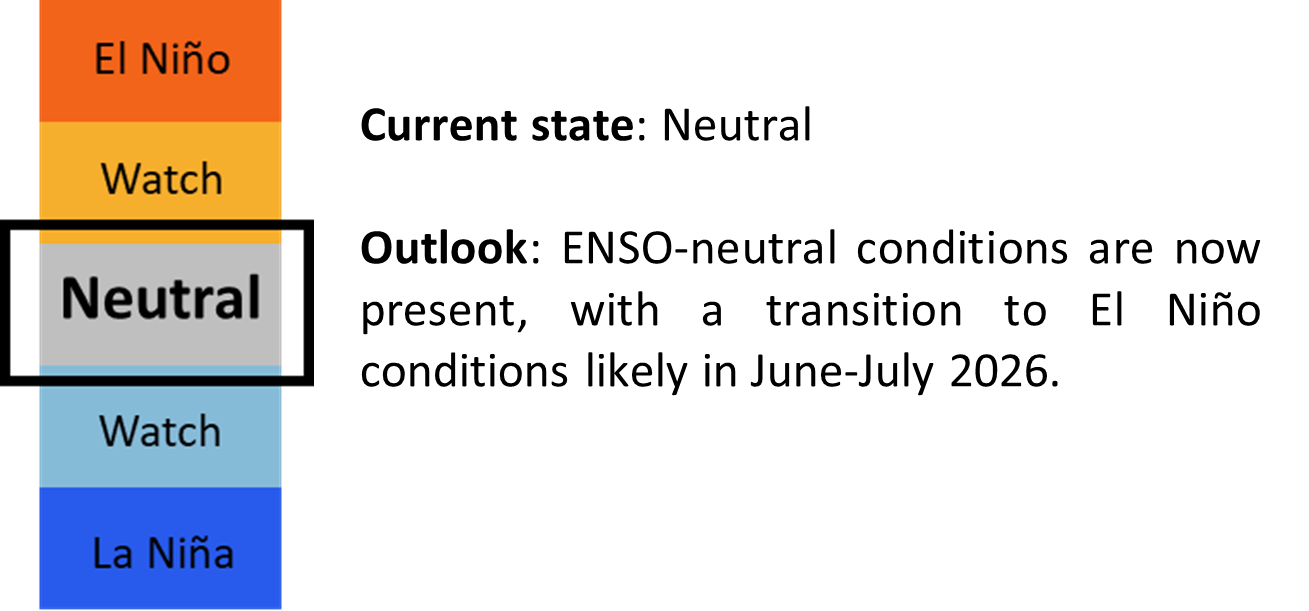
The El Niño – Southern Oscillation (ENSO) monitoring system state has transitioned to “Neutral”. The Nino3.4 index, while still negative, is within the ENSO-neutral range. Key atmospheric indicators of La Niña (increased cloudiness and stronger trade winds in the central Pacific) were observed in early March but are no longer present, in line with the transition to ENSO-neutral conditions. The Nino3.4 index was -0.59°C for March 2026 and 0.85°C for the three-month average January – March 2026 based on the Relative Oceanic Nino Index.
Models predict ENSO-neutral conditions during April – May 2026, with most predicting a transition to El Niño conditions in June-July 2026. However, there is still a chance of ENSO-neutral conditions continuing as models have lower accuracy at this time of the year.
Short note on the Indian Ocean Dipole: The Indian Ocean Dipole (IOD) is neutral. Models predict the neutral state to persist until June 2026.
Further Information on ENSO
ENSO conditions are monitored by analysing Pacific sea surface temperatures (SSTs), low level winds, cloudiness (using outgoing longwave radiation), and subsurface temperatures. Special attention is given to SSTs, as they are one of the key indicators used to monitor ENSO. Here, three different datasets are used: HadISST1.1, ERSSTv5, and COBE2 datasets. The Relative Nino3.4 index is used, which compares the SSTs in the Nino3.4 region with the tropical average, accounting for long-term and other shifts in the climate.
El Niño (La Niña) conditions are associated with warmer (colder) SST anomalies in the central and eastern Pacific. The threshold for an El Niño (La Niña) in the Nino3.4 Region is above 0.6°C (below -0.6°C). El Niño (La Niña) conditions also correspond to an increase (decrease) in cloudiness around or to the east of the international dateline (180°), with a decrease (increase) in cloudiness in the west. There is also a decrease (increase) in the trade winds in the eastern Pacific. Sub-surface temperatures in the eastern Pacific should also be warmer (colder) than average, to sustain the El Niño (La Niña) conditions.
International climate centres use different criteria, including different SST thresholds, suitable for their own region and applications. Therefore, variations between centres on the current ENSO state should be expected, especially when conditions are borderline.
The sea surface temperatures (SSTs) in the tropical Pacific in March 2026 were below- to near-average in the central portion of the region and above average in the west (Figure 1). The cool (negative) anomalies in the Nino3.4 region (red box) have reduced compared to the previous month, indicative of the transition to neutral conditions. Across the Indian Ocean, most of the equatorial region was near-average in temperature, indicative of a neutral IOD state.
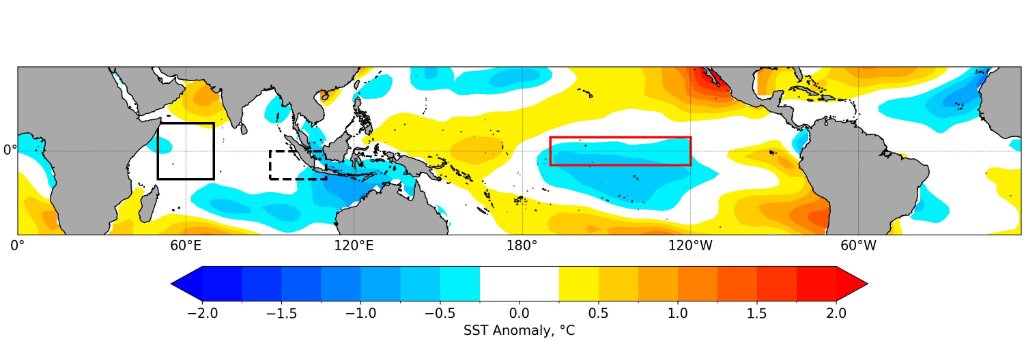
Figure 1: Relative SST anomalies (to the average tropical SST anomaly) for March 2026 using ERSST v5 data. Red (blue) shades show regions of relative warming (cooling). The tropical Pacific Ocean Nino3.4 Region is outlined in red. The Indian Ocean Dipole index is the difference between average SST anomalies over the western Indian Ocean (black solid box) and the eastern Indian Ocean (black dotted box).
Looking at the Relative Nino3.4 index in Figure 2, the 1-month Relative Nino3.4 index was negative, but within the neutral range, between March 2025 and August 2025. The index passed the La Niña threshold in September 2025 and returned to the neutral range in March 2026. For La Niña conditions to be present, 1-month cold SST anomalies (observed or forecast) should persist for at least four months below the threshold, with at least one of the months observed; along with supporting atmospheric observations.
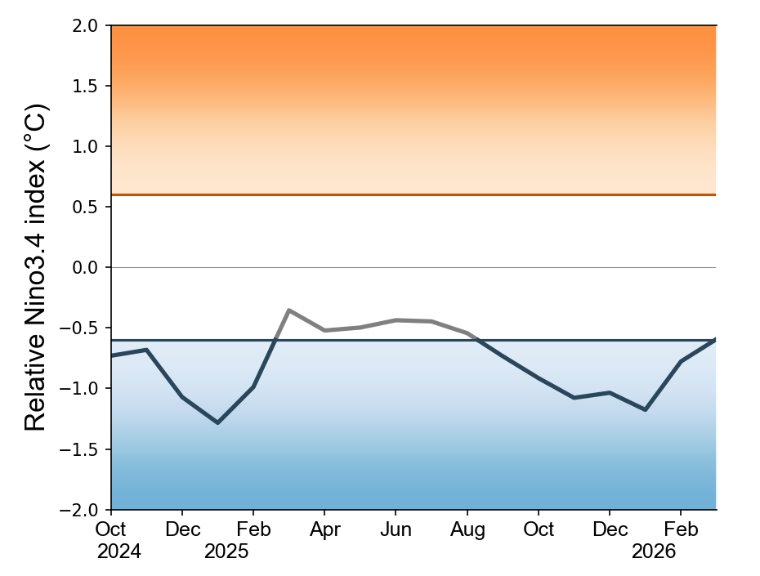
Figure 2: The Relative Nino3.4 index using the 1-month SST anomalies. Warm anomalies (≥ +0.6; brown4) correspond to El Niño conditions while cold anomalies (≤ -0.6; blue) correspond to La Niña conditions; otherwise neutral (> -0.6 and < +0.6; grey).
Model outlooks from Copernicus C3S (Figure 3), based on the Relative Nino3.4 SST index, predict the index to continue warming, with the ENSO-neutral conditions very likely to persist until May 2026. From June – July 2026, models predict El Niño conditions as the dominant phase, although there is still a chance for neutral conditions to continue. For those predicting El Nino conditions, models predicting the strength to be moderate to strong. However, there is still considerable uncertainty in the long-term forecasts at this time of the year, therefore the strength of the predicted El Niño conditions is uncertain.
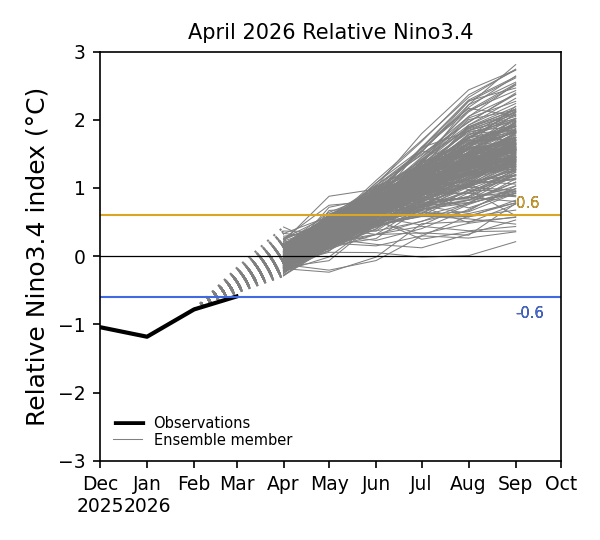
Figure 3: Forecasts of Relative Nino3.4 strength until September 2026 from various seasonal prediction models from international climate centres (grey lines). The solid blue and yellow lines note the La Niña and El Niño thresholds used by MSS.
Historical ENSO Variability
To classify a historical El Niño event, the Relative Oceanic Nino Index (RONI, or 3-month average Relative Nino3.4 value), must be above 0.6°C for 5 or more consecutive months. For La Niña events, the threshold is -0.6°C. Otherwise it is considered neutral. ENSO events with a peak value above 1.5°C (El Niño) or below -1.5°C (La Niña) are considered strong. Otherwise, the events are considered weak to moderate in strength. The following figure (Figure 4) shows the development the Relative Nino3.4 index for recent El Niño and La Niña events in comparison to other El Niño/La Niña events.
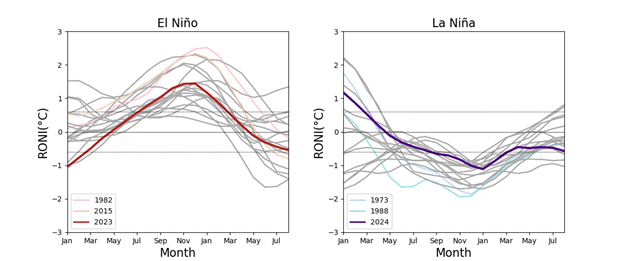
Figure 4: Relative Oceanic Nino Index (RONI) development and retreat of different El Niño (left)/La Niña (right) events since the 1960s. Recent El Niño and La Niña events are in red and purple, respectively.
Impact of El Niño/La Niña on Singapore
During the first inter-monsoon period, ENSO has a small influence on Singapore’s rainfall (Figure 5). Between February and May, La Niña events tend to bring wetter conditions than El Niño events, although there is still a lot of year-to-year variability (Figure 6). The relationship between ENSO and Singapore’s rainfall strengthens during the Southwest Monsoon (Figure 5). However, there is still considerable variability, particularly at the monthly timescale.
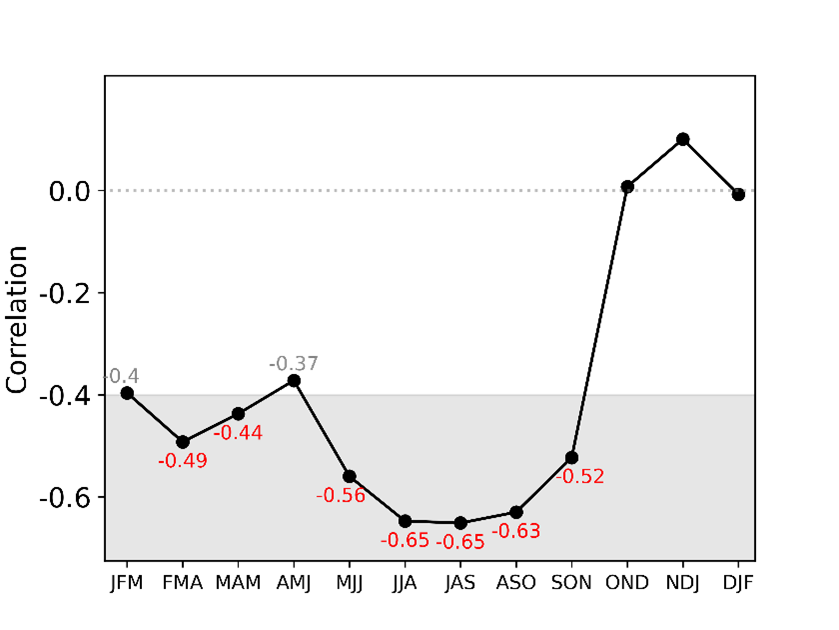
Figure 5: Correlation between total 3-month seasonal rainfall (averaged over Singapore stations) and seasonal Nino3.4 index from 1991-2025. The statistically significant correlations at the 95% level (±0.34) in grey, and at 99% level (±0.43) in red.
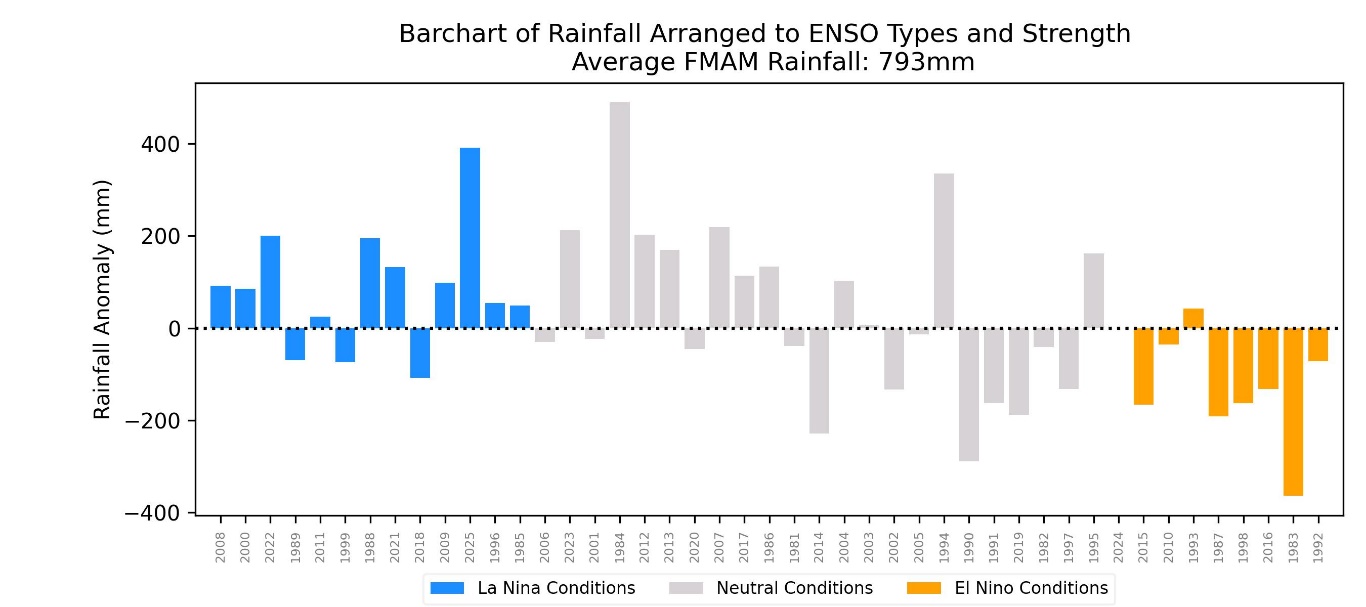
Figure 6: Singapore rainfall anomalies for February – May (as a departure from the 1991-2020 long-term rainfall average) arranged in the order from strong La Niña (left) to strong El Niño (right). Orange bars denote El Niño years’ anomalies, blue bars denote La Niña years’ anomalies, and grey bars denote ENSO neutral years’ anomalies.
References
Turkington, T., Timbal, B., & Rahmat, R. (2018). The impact of global warming on sea surface temperature based El Nino Southern Oscillation monitoring indices. International Journal of Climatology, 39(2).